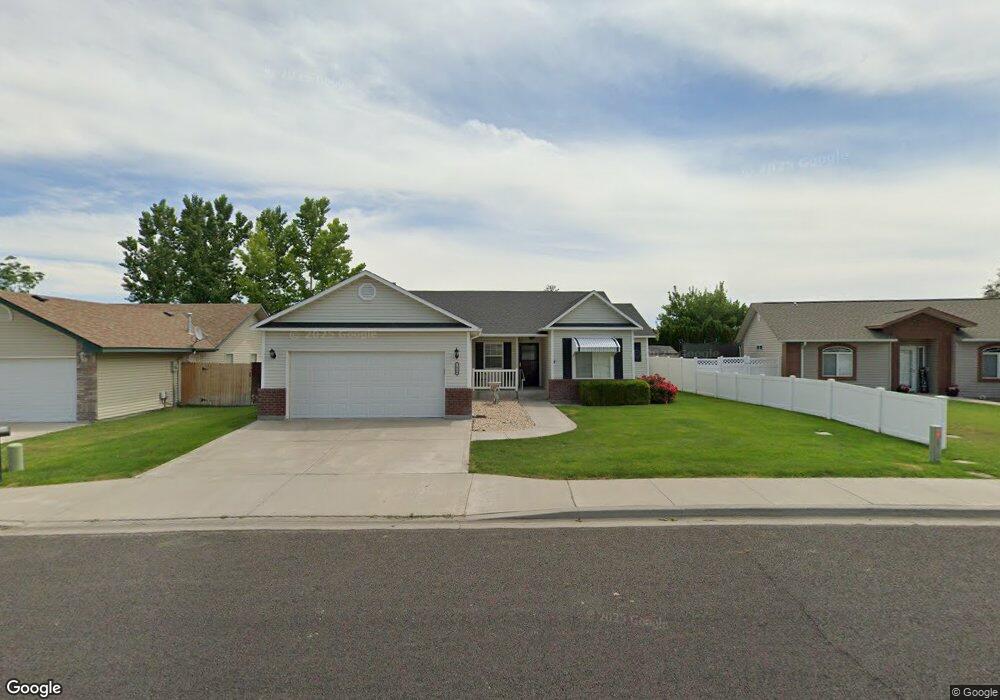
1448 N North Pointe Twin Falls, ID 83301
Estimated Value: $326,000 - $360,000
3
Beds
2
Baths
1,393
Sq Ft
$248/Sq Ft
Est. Value
About This Home
This home is located at 1448 N North Pointe, Twin Falls, ID 83301 and is currently estimated at $345,825, approximately $248 per square foot. 1448 N North Pointe is a home located in Twin Falls County with nearby schools including Rock Creek Elementary School, Robert Stuart Junior High School, and Canyon Ridge High School.
Ownership History
Date
Name
Owned For
Owner Type
Purchase Details
Closed on
May 10, 2023
Sold by
Wanman Jana Lee
Bought by
Nielsen Judith
Current Estimated Value
Purchase Details
Closed on
Nov 14, 2013
Sold by
Wanman Yyutonna F
Bought by
Wanman Fred
Purchase Details
Closed on
Jun 22, 2009
Sold by
Watson Linda
Bought by
Thom Judith Mary
Home Financials for this Owner
Home Financials are based on the most recent Mortgage that was taken out on this home.
Original Mortgage
$115,680
Interest Rate
4.83%
Mortgage Type
New Conventional
Purchase Details
Closed on
May 31, 2005
Sold by
Jones Jeff and Jones Jennifer
Bought by
Watson Linda
Home Financials for this Owner
Home Financials are based on the most recent Mortgage that was taken out on this home.
Original Mortgage
$20,355
Interest Rate
5.74%
Mortgage Type
Credit Line Revolving
Create a Home Valuation Report for This Property
The Home Valuation Report is an in-depth analysis detailing your home's value as well as a comparison with similar homes in the area
Home Values in the Area
Average Home Value in this Area
Purchase History
| Date | Buyer | Sale Price | Title Company |
|---|---|---|---|
| Nielsen Judith | -- | Titleone | |
| Wanman Fred | -- | Alliance Title | |
| Wanman Fred | -- | Alliance Title | |
| Thom Judith Mary | -- | -- | |
| Watson Linda | -- | -- |
Source: Public Records
Mortgage History
| Date | Status | Borrower | Loan Amount |
|---|---|---|---|
| Previous Owner | Thom Judith Mary | $115,680 | |
| Previous Owner | Watson Linda | $20,355 |
Source: Public Records
Tax History Compared to Growth
Tax History
| Year | Tax Paid | Tax Assessment Tax Assessment Total Assessment is a certain percentage of the fair market value that is determined by local assessors to be the total taxable value of land and additions on the property. | Land | Improvement |
|---|---|---|---|---|
| 2025 | $1,409 | $274,081 | $59,991 | $214,090 |
| 2024 | $1,409 | $274,222 | $59,991 | $214,231 |
| 2023 | $3,040 | $290,705 | $59,991 | $230,714 |
| 2022 | $523 | $301,712 | $61,860 | $239,852 |
| 2021 | $680 | $229,791 | $52,404 | $177,387 |
| 2020 | $611 | $192,871 | $48,989 | $143,882 |
| 2019 | $390 | $183,576 | $45,049 | $138,527 |
| 2018 | $764 | $173,439 | $30,208 | $143,231 |
| 2017 | $680 | $160,072 | $30,208 | $129,864 |
| 2016 | $627 | $141,403 | $0 | $0 |
| 2015 | $559 | $141,403 | $30,208 | $111,195 |
| 2012 | -- | $130,063 | $0 | $0 |
Source: Public Records
Map
Nearby Homes
- 1434 Tara St
- 1494 Northern Pine Dr
- 612 Northern Pine Ct
- 630 N Pointe Dr
- 1435 Anny Dr W
- 1108 Twin Parks Dr
- 551 Park Meadows Cir
- 805 Drayton Ave
- 1230 Blake St N
- 891 N Pointe Dr
- 850 Broadmoor Ave
- 905 Birchton Loop
- 632 Crestview Dr
- 938 Starlight Loop
- 521 Falling Leaf Ln
- 513 Falling Leaf Ln
- 1143 Langford Way
- 534 Falling Leaf Ln
- 1378 Misty Meadows Ct
- 1039 Blake St N
- 1448 N Pointe Dr
- 1436 N Pointe Dr
- 1447 Tara St
- 1435 Tara St
- 1455 N Pointe Dr
- 1459 Tara St
- 550 Megan Ct
- 1424 N Pointe Dr
- 1471 N Pointe Dr
- 1441 N Pointe Dr
- 589 Sarah Ave
- 1423 Tara St
- 1471 Tara St
- 1421 N Pointe Dr
- 1412 N Pointe Dr
- 1411 Tara St
- 1489 N Pointe Dr
- 590 Sarah Ave
- 1446 Tara St
- 1412 Northern Pine Dr