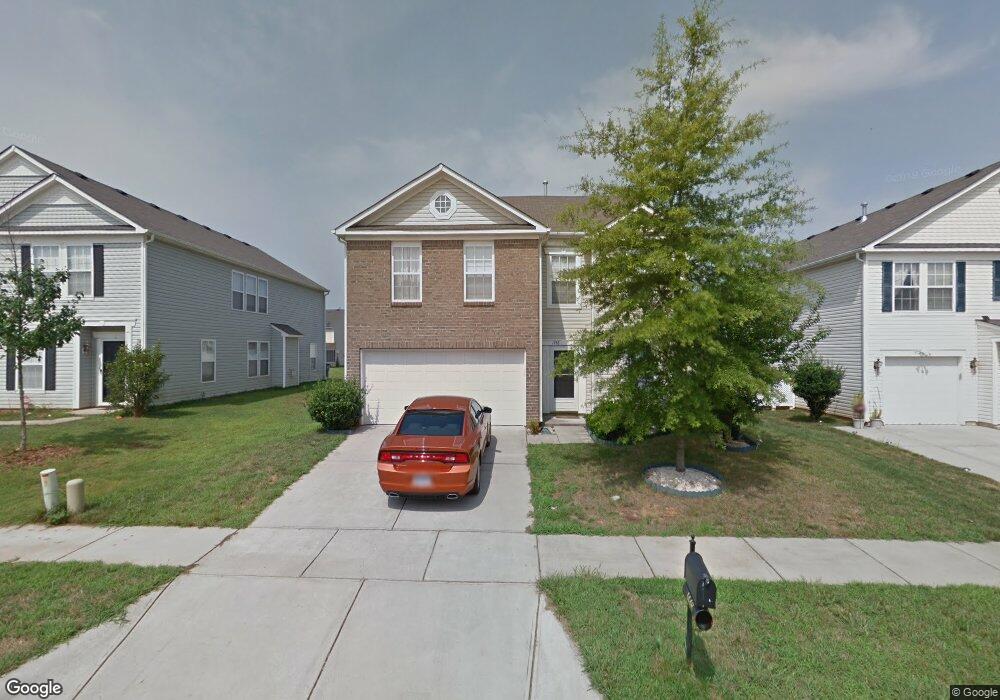
1448 Tygress St Kannapolis, NC 28081
Estimated Value: $339,000 - $361,000
3
Beds
3
Baths
2,613
Sq Ft
$134/Sq Ft
Est. Value
About This Home
This home is located at 1448 Tygress St, Kannapolis, NC 28081 and is currently estimated at $350,496, approximately $134 per square foot. 1448 Tygress St is a home located in Cabarrus County with nearby schools including Winecoff Elementary School, Northwest Cabarrus Middle School, and Northwest Cabarrus High.
Ownership History
Date
Name
Owned For
Owner Type
Purchase Details
Closed on
Oct 6, 2014
Sold by
Wyant Brandi and Wyant Joshua
Bought by
Crouch Michael
Current Estimated Value
Home Financials for this Owner
Home Financials are based on the most recent Mortgage that was taken out on this home.
Original Mortgage
$111,000
Outstanding Balance
$85,285
Interest Rate
4.16%
Mortgage Type
New Conventional
Estimated Equity
$265,211
Purchase Details
Closed on
Apr 5, 2006
Sold by
C P Morgan Communities Of Charlotte Llc
Bought by
Schwinn Brandi and Wyant Joshua
Home Financials for this Owner
Home Financials are based on the most recent Mortgage that was taken out on this home.
Original Mortgage
$159,955
Interest Rate
6.23%
Mortgage Type
FHA
Purchase Details
Closed on
Jan 30, 2006
Sold by
Craft Development Llc
Bought by
C P Morgan Communities Of Charlotte Llc
Create a Home Valuation Report for This Property
The Home Valuation Report is an in-depth analysis detailing your home's value as well as a comparison with similar homes in the area
Home Values in the Area
Average Home Value in this Area
Purchase History
We collect this data history from publicly available records. To have your information removed, we recommend requesting removal directly through your county’s website.
| Date | Buyer | Sale Price | Title Company |
|---|---|---|---|
| Crouch Michael | $141,000 | None Available | |
| Schwinn Brandi | $162,000 | None Available | |
| C P Morgan Communities Of Charlotte Llc | $135,000 | None Available |
Source: Public Records
Mortgage History
We collect this data history from publicly available records. To have your information removed, we recommend requesting removal directly through your county’s website.
| Date | Status | Borrower | Loan Amount |
|---|---|---|---|
| Open | Crouch Michael | $111,000 | |
| Previous Owner | Schwinn Brandi | $159,955 |
Source: Public Records
Tax History
| Year | Tax Paid | Tax Assessment Tax Assessment Total Assessment is a certain percentage of the fair market value that is determined by local assessors to be the total taxable value of land and additions on the property. | Land | Improvement |
|---|---|---|---|---|
| 2025 | $4,022 | $354,240 | $65,000 | $289,240 |
| 2024 | $4,022 | $354,240 | $65,000 | $289,240 |
| 2023 | $2,671 | $194,930 | $38,000 | $156,930 |
| 2022 | $2,671 | $194,930 | $38,000 | $156,930 |
| 2021 | $2,671 | $194,930 | $38,000 | $156,930 |
| 2020 | $2,671 | $194,930 | $38,000 | $156,930 |
| 2019 | $1,994 | $145,520 | $20,000 | $125,520 |
| 2018 | $1,965 | $145,520 | $20,000 | $125,520 |
| 2017 | $1,935 | $145,520 | $20,000 | $125,520 |
| 2016 | $1,935 | $150,450 | $23,000 | $127,450 |
| 2015 | $1,896 | $150,450 | $23,000 | $127,450 |
| 2014 | $1,896 | $150,450 | $23,000 | $127,450 |
Source: Public Records
Map
Nearby Homes
- 303 Rogers Lake Rd
- 569 Westwood Dr
- 0 Elwood St
- 1540 Cooper Ave
- 304 Lowrance Ave
- 1309 Red Birch Place Unit 8
- 1303 Wildwood Dr
- 1416 Browdis Ave
- 2080 S Main St
- 1237 Haywood Ave
- 1418 Azalea Ave
- 103 Carriage House Dr
- 303 Odell St
- 302 Suburban Ave
- 222 Cliffside Dr
- 301 Briarcliff Dr
- 312 Cook St
- 406 Courtland Ct
- 587 Marigold Dr
- 1407 Sherwood Dr
- 1595 Matthew Allen Cir
- 1585 Matthew Allen Cir
- 1601 Matthew Allen Cir
- 1575 Matthew Allen Cir
- 1432 Tygress St
- 1436 Tygress St
- 1428 Tygress St
- 1605 Matthew Allen Cir
- 1571 Matthew Allen Cir
- 1571 Matthew Allen Cir Unit 51
- 1440 Tygress St
- 1428 Tygress Dr
- 1428 Tygress Dr Unit 65
- 1424 Tygress St
- 1590 Matthew Allen Cir
- 1596 Matthew Allen Cir
- 1596 Matthew Allen Cir Unit 32
- 1584 Matthew Allen Cir
- 1444 Tygress St
- 1602 Matthew Allen Cir
Your Personal Tour Guide
Ask me questions while you tour the home.