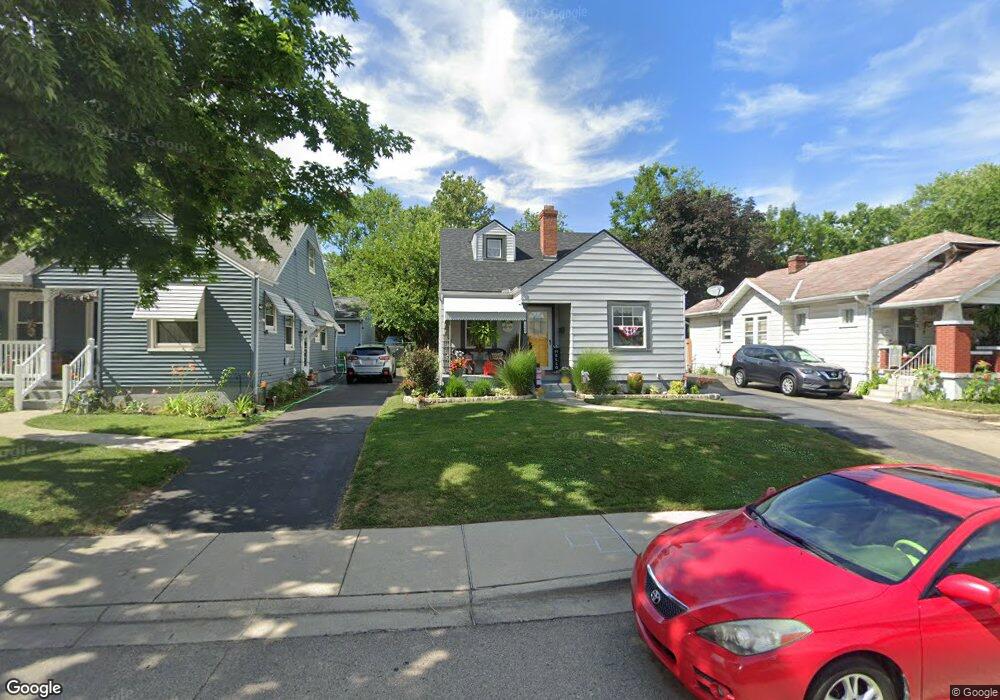
1449 Melrose Ave Dayton, OH 45409
Estimated Value: $155,000 - $207,000
3
Beds
1
Bath
936
Sq Ft
$198/Sq Ft
Est. Value
About This Home
This home is located at 1449 Melrose Ave, Dayton, OH 45409 and is currently estimated at $185,328, approximately $198 per square foot. 1449 Melrose Ave is a home located in Montgomery County with nearby schools including Southdale Elementary School, Van Buren Middle School, and Kettering Fairmont High School.
Ownership History
Date
Name
Owned For
Owner Type
Purchase Details
Closed on
Aug 31, 2018
Sold by
Navarro Linda and Navarro Sergio
Bought by
Poore Nick P
Current Estimated Value
Home Financials for this Owner
Home Financials are based on the most recent Mortgage that was taken out on this home.
Original Mortgage
$92,610
Outstanding Balance
$80,595
Interest Rate
4.5%
Mortgage Type
Purchase Money Mortgage
Estimated Equity
$104,733
Purchase Details
Closed on
Mar 2, 2018
Sold by
Miller William R and Estate Of Craig Gibson
Bought by
Navarro Linda and Navarro Sergio
Purchase Details
Closed on
Feb 28, 2018
Sold by
Byrne Constance and Gibson Gary
Bought by
Navarro Linda and Navarro Sergio
Purchase Details
Closed on
Apr 18, 2002
Sold by
Estate Of Alma Jean Gibson
Bought by
Byrne Constance and Gibson Craig
Purchase Details
Closed on
Sep 8, 1999
Sold by
Estate Of Hobert C Gibson
Bought by
Gibson Alma Jean
Create a Home Valuation Report for This Property
The Home Valuation Report is an in-depth analysis detailing your home's value as well as a comparison with similar homes in the area
Home Values in the Area
Average Home Value in this Area
Purchase History
| Date | Buyer | Sale Price | Title Company |
|---|---|---|---|
| Poore Nick P | $102,900 | Fidelity Lawyers Title Agenc | |
| Navarro Linda | $12,000 | None Available | |
| Navarro Linda | $12,000 | None Available | |
| Byrne Constance | -- | -- | |
| Gibson Alma Jean | -- | -- |
Source: Public Records
Mortgage History
| Date | Status | Borrower | Loan Amount |
|---|---|---|---|
| Open | Poore Nick P | $92,610 |
Source: Public Records
Tax History Compared to Growth
Tax History
| Year | Tax Paid | Tax Assessment Tax Assessment Total Assessment is a certain percentage of the fair market value that is determined by local assessors to be the total taxable value of land and additions on the property. | Land | Improvement |
|---|---|---|---|---|
| 2024 | $3,076 | $49,380 | $13,320 | $36,060 |
| 2023 | $3,076 | $49,380 | $13,320 | $36,060 |
| 2022 | $2,587 | $32,770 | $8,820 | $23,950 |
| 2021 | $2,393 | $32,770 | $8,820 | $23,950 |
| 2020 | $2,400 | $32,770 | $8,820 | $23,950 |
| 2019 | $2,147 | $25,880 | $8,820 | $17,060 |
| 2018 | $2,159 | $25,880 | $8,820 | $17,060 |
| 2017 | $1,989 | $25,880 | $8,820 | $17,060 |
| 2016 | $2,070 | $25,320 | $8,820 | $16,500 |
| 2015 | $1,978 | $25,320 | $8,820 | $16,500 |
| 2014 | $1,978 | $25,320 | $8,820 | $16,500 |
| 2012 | -- | $28,350 | $8,820 | $19,530 |
Source: Public Records
Map
Nearby Homes
- 1424 Elmdale Dr
- 1545 Cardington Rd
- 1364 Elmdale Dr
- 1554 Crescent Blvd
- 1536 Old Lane Ave
- 1129 W Dorothy Ln
- 1597 Old Lane Ave
- 3060 Regent St
- 1473 Constance Ave Unit 1481
- 3225 Southdale Dr Unit 1
- 2467 S Dixie Dr
- 1151 Brookview Ave
- 1314 Ridgeview Ave
- 1420 Adirondack Trail
- 1125 Laurelwood Rd
- 1615 Carrollton Ave
- 2230 S Patterson Blvd
- 1349 Tamerlane Rd
- 3464 Southern Blvd
- 1211 Runnymede Rd
- 1441 Melrose Ave
- 1457 Melrose Ave
- 1465 Melrose Ave
- 1433 Melrose Ave
- 1473 Melrose Ave
- 1425 Melrose Ave
- 1464 Cardington Rd
- 1448 Cardington Rd
- 1481 Melrose Ave
- 1417 Melrose Ave
- 1472 Cardington Rd
- 1456 Melrose Ave
- 0 Crescent Blvd
- 1464 Melrose Ave
- 1448 Melrose Ave
- 1440 Cardington Rd
- 1472 Melrose Ave
- 1440 Melrose Ave
- 1409 Melrose Ave
- 1480 Melrose Ave