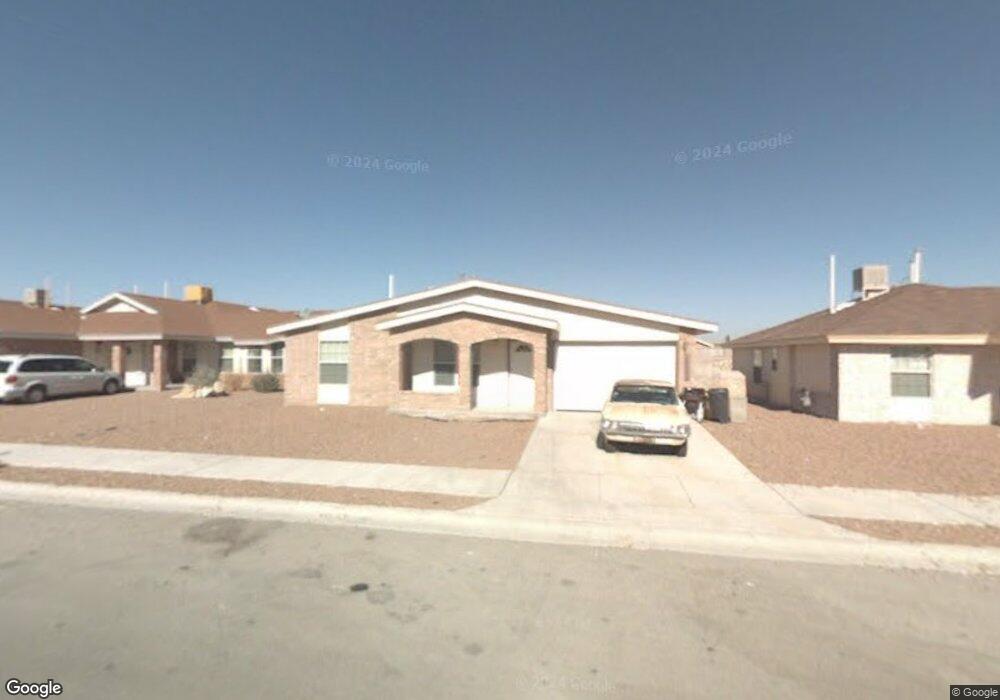
14497 Thayer Pease Ave Horizon City, TX 79928
Estimated Value: $171,000 - $197,000
3
Beds
2
Baths
1,091
Sq Ft
$169/Sq Ft
Est. Value
About This Home
This home is located at 14497 Thayer Pease Ave, Horizon City, TX 79928 and is currently estimated at $184,246, approximately $168 per square foot. 14497 Thayer Pease Ave is a home located in El Paso County with nearby schools including Carroll T. Welch Elementary School, Ricardo Estrada Junior High School, and Horizon High School.
Ownership History
Date
Name
Owned For
Owner Type
Purchase Details
Closed on
Mar 31, 2010
Sold by
Barankovich George Burt
Bought by
Jaramillo Mendez Juan Carlos and Jaramillo Alicia
Current Estimated Value
Home Financials for this Owner
Home Financials are based on the most recent Mortgage that was taken out on this home.
Original Mortgage
$77,569
Outstanding Balance
$52,927
Interest Rate
5.5%
Mortgage Type
FHA
Estimated Equity
$131,319
Purchase Details
Closed on
Sep 7, 2007
Sold by
Barankovich George B
Bought by
14497 Thayer Pease Trust
Purchase Details
Closed on
Jun 9, 2006
Sold by
Vista Serena Homes Llc
Bought by
Barankovich George B
Home Financials for this Owner
Home Financials are based on the most recent Mortgage that was taken out on this home.
Original Mortgage
$8,000
Interest Rate
6.56%
Mortgage Type
Stand Alone Second
Create a Home Valuation Report for This Property
The Home Valuation Report is an in-depth analysis detailing your home's value as well as a comparison with similar homes in the area
Home Values in the Area
Average Home Value in this Area
Purchase History
| Date | Buyer | Sale Price | Title Company |
|---|---|---|---|
| Jaramillo Mendez Juan Carlos | -- | None Available | |
| 14497 Thayer Pease Trust | -- | None Available | |
| Barankovich George B | -- | None Available |
Source: Public Records
Mortgage History
| Date | Status | Borrower | Loan Amount |
|---|---|---|---|
| Open | Jaramillo Mendez Juan Carlos | $77,569 | |
| Previous Owner | Barankovich George B | $8,000 | |
| Previous Owner | Barankovich George B | $61,210 |
Source: Public Records
Tax History Compared to Growth
Tax History
| Year | Tax Paid | Tax Assessment Tax Assessment Total Assessment is a certain percentage of the fair market value that is determined by local assessors to be the total taxable value of land and additions on the property. | Land | Improvement |
|---|---|---|---|---|
| 2025 | $3,193 | $149,019 | -- | -- |
| 2024 | $3,193 | $135,472 | -- | -- |
| 2023 | $2,734 | $123,156 | $0 | $0 |
| 2022 | $3,630 | $111,960 | $0 | $0 |
| 2021 | $3,632 | $125,791 | $14,414 | $111,377 |
| 2020 | $3,214 | $92,529 | $14,414 | $78,115 |
| 2018 | $2,828 | $84,270 | $14,414 | $69,856 |
| 2017 | $2,725 | $82,053 | $13,837 | $68,216 |
| 2016 | $2,667 | $80,325 | $13,837 | $66,488 |
| 2015 | $2,233 | $80,325 | $13,837 | $66,488 |
| 2014 | $2,233 | $77,716 | $13,837 | $63,879 |
Source: Public Records
Map
Nearby Homes
- 440 Katherine Dr
- TBD 11 Horizon City Estates #4
- 13809 Centro Vista Ave
- 1 Acre Grey Ave
- 2.47 Acres Agatha St
- PN-360685 Tbd
- PN- 13111 Tbd
- PN-123086 Tbd
- 13829 Centro Vista
- 13841 Centro Vista Ave
- 13737 Centro Vista Ave
- 13833 Centro Vista Ave
- 13745 Centro Vista Ave
- 536 Thayer Pease Ave
- PN-261611 Egypt Ave
- TBD Calverton St
- 14253 Bryce Dr
- 15318 Northport Ct
- TBD Lailey View Ct
- 228 Tierra Linda Dr
- 14497 Thayer Pease Ave Unit 8B
- 14497 Thayer Pease Ave
- 14493 Thayer Pease Ave
- 14493 Thayer Pease Ave Unit 8B
- 14501 Thayer Pease Ave
- 14501 Thayer Pease Ave Unit 8B
- 14501 Thayer Pease Ave Unit 1
- 14501 Thayer Pease Ave
- 14496 Canario Dr
- 14500 Canario Dr
- 14505 Thayer Pease Ave
- 14505 Thayer Pease Ave Unit 8B
- 14489 Thayer Pease Ave
- 14489 Thayer Pease Ave Unit 8B
- 14489 Thayer Pease Ave Unit 1
- 14489 Thayer Pease Ave
- 14492 Canario Dr
- 14504 Canario Dr
- 14492 Thayer Pease Ave
- 14485 Thayer Pease Ave Unit 8B