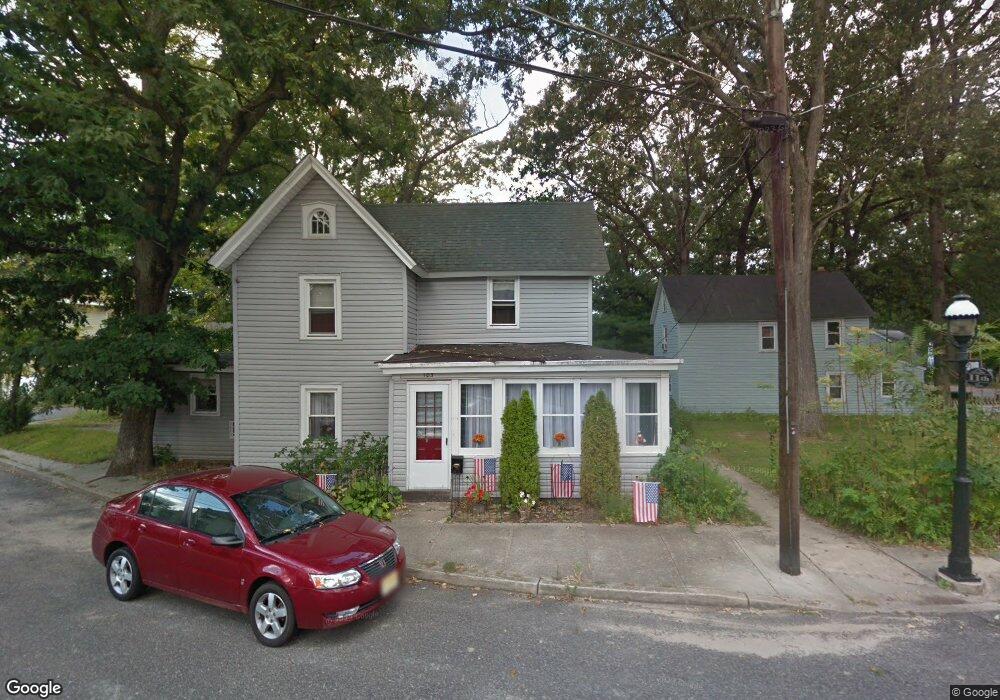
145 11th Ave Pitman, NJ 08071
Estimated Value: $203,512 - $244,000
Studio
--
Bath
872
Sq Ft
$262/Sq Ft
Est. Value
About This Home
This home is located at 145 11th Ave, Pitman, NJ 08071 and is currently estimated at $228,128, approximately $261 per square foot. 145 11th Ave is a home located in Gloucester County with nearby schools including W.C.K. Walls Elementary School, Pitman Middle School, and Pitman High School.
Ownership History
Date
Name
Owned For
Owner Type
Purchase Details
Closed on
Feb 10, 1999
Sold by
Giberson Russell and Giberson Edith
Bought by
Giberson Russell and Giberson Edith
Current Estimated Value
Purchase Details
Closed on
Oct 29, 1993
Sold by
Mollenhauer Erik
Bought by
Giberson Russell and Giberson Edith
Home Financials for this Owner
Home Financials are based on the most recent Mortgage that was taken out on this home.
Original Mortgage
$71,000
Interest Rate
6.77%
Mortgage Type
VA
Create a Home Valuation Report for This Property
The Home Valuation Report is an in-depth analysis detailing your home's value as well as a comparison with similar homes in the area
Home Values in the Area
Average Home Value in this Area
Purchase History
| Date | Buyer | Sale Price | Title Company |
|---|---|---|---|
| Giberson Russell | -- | -- | |
| Giberson Russell | -- | -- | |
| Giberson Russell | $69,500 | -- |
Source: Public Records
Mortgage History
| Date | Status | Borrower | Loan Amount |
|---|---|---|---|
| Previous Owner | Giberson Russell | $71,000 |
Source: Public Records
Tax History
| Year | Tax Paid | Tax Assessment Tax Assessment Total Assessment is a certain percentage of the fair market value that is determined by local assessors to be the total taxable value of land and additions on the property. | Land | Improvement |
|---|---|---|---|---|
| 2025 | $4,101 | $117,400 | $24,600 | $92,800 |
| 2024 | $3,993 | $117,400 | $24,600 | $92,800 |
| 2023 | $3,993 | $117,400 | $24,600 | $92,800 |
| 2022 | $3,835 | $117,400 | $24,600 | $92,800 |
| 2021 | $2,972 | $77,300 | $20,300 | $57,000 |
| 2020 | $3,424 | $77,300 | $20,300 | $57,000 |
| 2019 | $3,344 | $77,300 | $20,300 | $57,000 |
| 2018 | $3,288 | $77,300 | $20,300 | $57,000 |
| 2017 | $3,247 | $77,300 | $20,300 | $57,000 |
| 2016 | $3,184 | $77,300 | $20,300 | $57,000 |
| 2015 | $3,098 | $77,300 | $20,300 | $57,000 |
| 2014 | $3,003 | $77,300 | $20,300 | $57,000 |
Source: Public Records
Map
Nearby Homes
- 142 2nd Ave
- 135 Laurel Ave
- 198 West Ave
- 14 4th Ave
- 127 W Holly Ave
- 349 W Jersey Ave
- 407 Tuohy Ave
- 315 Lake Ave
- 302 Montgomery Ave
- 1300 Cedar Ave
- 344 Columbia Ave
- 302 Washington Ave
- 205 Adams Ave
- 1040 N Main St
- 508 Hudson Ave
- 103 N Brentwood Ave
- 237 Adams Ave
- 603 Hudson Ave
- 30 N Woodbury Rd
- 0 Lambs Rd Unit NJGL2048944
Your Personal Tour Guide
Ask me questions while you tour the home.