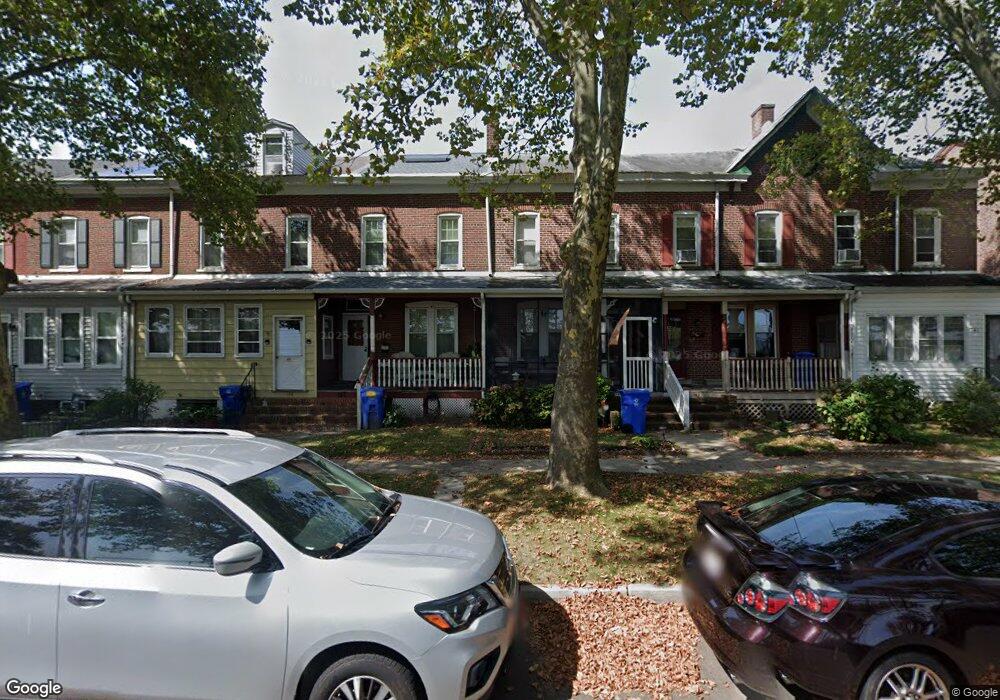
145 2nd Ave Roebling, NJ 08554
Estimated Value: $163,000 - $256,997
--
Bed
--
Bath
1,152
Sq Ft
$192/Sq Ft
Est. Value
About This Home
This home is located at 145 2nd Ave, Roebling, NJ 08554 and is currently estimated at $220,999, approximately $191 per square foot. 145 2nd Ave is a home located in Burlington County with nearby schools including Number 5, Roebling Elementary School, Riverfront Middle School, and Florence Twp Mem High School.
Ownership History
Date
Name
Owned For
Owner Type
Purchase Details
Closed on
Mar 24, 2004
Sold by
Dannucci Keith J
Bought by
Fielder Tara
Current Estimated Value
Home Financials for this Owner
Home Financials are based on the most recent Mortgage that was taken out on this home.
Original Mortgage
$22,980
Interest Rate
6.12%
Mortgage Type
Credit Line Revolving
Purchase Details
Closed on
Aug 21, 2000
Sold by
Bovin Lucy
Bought by
Dannucci Keith J
Home Financials for this Owner
Home Financials are based on the most recent Mortgage that was taken out on this home.
Original Mortgage
$68,500
Interest Rate
8.07%
Mortgage Type
Stand Alone First
Create a Home Valuation Report for This Property
The Home Valuation Report is an in-depth analysis detailing your home's value as well as a comparison with similar homes in the area
Home Values in the Area
Average Home Value in this Area
Purchase History
| Date | Buyer | Sale Price | Title Company |
|---|---|---|---|
| Fielder Tara | $114,900 | -- | |
| Dannucci Keith J | $68,500 | -- |
Source: Public Records
Mortgage History
| Date | Status | Borrower | Loan Amount |
|---|---|---|---|
| Closed | Fielder Tara | $22,980 | |
| Open | Fielder Tara | $91,920 | |
| Previous Owner | Dannucci Keith J | $68,500 |
Source: Public Records
Tax History Compared to Growth
Tax History
| Year | Tax Paid | Tax Assessment Tax Assessment Total Assessment is a certain percentage of the fair market value that is determined by local assessors to be the total taxable value of land and additions on the property. | Land | Improvement |
|---|---|---|---|---|
| 2025 | $3,698 | $132,700 | $46,000 | $86,700 |
| 2024 | $3,540 | $132,700 | $46,000 | $86,700 |
| 2023 | $3,540 | $132,700 | $46,000 | $86,700 |
| 2022 | $3,465 | $132,700 | $46,000 | $86,700 |
| 2021 | $3,434 | $132,700 | $46,000 | $86,700 |
| 2020 | $3,421 | $132,700 | $46,000 | $86,700 |
| 2019 | $3,390 | $132,700 | $46,000 | $86,700 |
| 2018 | $3,361 | $132,700 | $46,000 | $86,700 |
| 2017 | $3,320 | $132,700 | $46,000 | $86,700 |
| 2016 | $3,256 | $132,700 | $46,000 | $86,700 |
| 2015 | $3,190 | $132,700 | $46,000 | $86,700 |
| 2014 | $3,452 | $147,700 | $46,000 | $101,700 |
Source: Public Records
Map
Nearby Homes