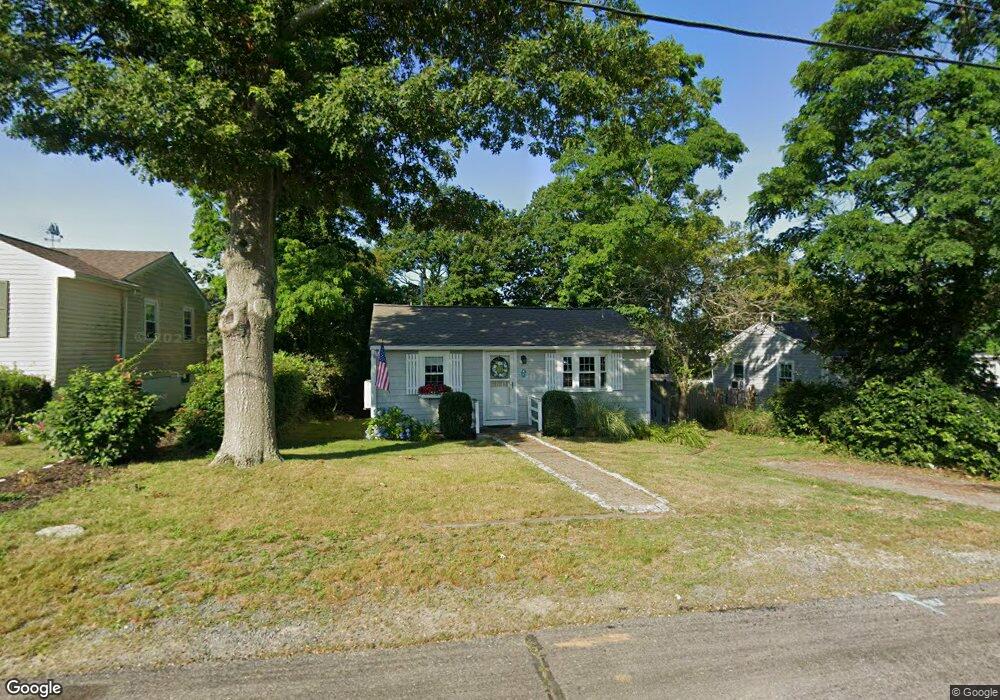
145 Arnold Rd Unit ,0 Marshfield, MA 02050
Ocean Bluff-Brant Rock NeighborhoodEstimated Value: $524,839 - $628,000
2
Beds
1
Bath
788
Sq Ft
$706/Sq Ft
Est. Value
About This Home
This home is located at 145 Arnold Rd Unit ,0, Marshfield, MA 02050 and is currently estimated at $555,960, approximately $705 per square foot. 145 Arnold Rd Unit ,0 is a home located in Plymouth County with nearby schools including Governor Edward Winslow School, Furnace Brook Middle School, and Marshfield High School.
Ownership History
Date
Name
Owned For
Owner Type
Purchase Details
Closed on
Mar 15, 2005
Sold by
Laselva Michael S
Bought by
Manning Corey J and Manning Karen M
Current Estimated Value
Purchase Details
Closed on
Jan 17, 2001
Sold by
Mccarville Ret
Bought by
Laselva Michael S
Purchase Details
Closed on
Dec 5, 1997
Sold by
Quilty Mary T and Buckley Steven J
Bought by
Mccarville Robert H
Purchase Details
Closed on
Jul 1, 1997
Sold by
Scribner Dean M
Bought by
Quilty Mary T and Buckley Steven J
Purchase Details
Closed on
Sep 6, 1995
Sold by
Krusell Peter W and Krusell Eric H
Bought by
Scribner Dean M
Purchase Details
Closed on
Apr 4, 1995
Sold by
Marsk Hilda Me Est
Bought by
Krusell Peter W and Krusell Eric H
Create a Home Valuation Report for This Property
The Home Valuation Report is an in-depth analysis detailing your home's value as well as a comparison with similar homes in the area
Home Values in the Area
Average Home Value in this Area
Purchase History
| Date | Buyer | Sale Price | Title Company |
|---|---|---|---|
| Manning Corey J | $288,000 | -- | |
| Manning Corey J | $288,000 | -- | |
| Laselva Michael S | $157,000 | -- | |
| Laselva Michael S | $157,000 | -- | |
| Mccarville Robert H | $122,500 | -- | |
| Mccarville Robert H | $122,500 | -- | |
| Quilty Mary T | $115,000 | -- | |
| Quilty Mary T | $115,000 | -- | |
| Scribner Dean M | $103,000 | -- | |
| Scribner Dean M | $103,000 | -- | |
| Krusell Peter W | $63,500 | -- | |
| Krusell Peter W | $63,500 | -- |
Source: Public Records
Mortgage History
| Date | Status | Borrower | Loan Amount |
|---|---|---|---|
| Open | Krusell Peter W | $219,000 | |
| Closed | Krusell Peter W | $232,000 |
Source: Public Records
Tax History
| Year | Tax Paid | Tax Assessment Tax Assessment Total Assessment is a certain percentage of the fair market value that is determined by local assessors to be the total taxable value of land and additions on the property. | Land | Improvement |
|---|---|---|---|---|
| 2025 | $4,683 | $473,000 | $317,600 | $155,400 |
| 2024 | $4,284 | $412,300 | $297,800 | $114,500 |
| 2023 | $4,079 | $361,900 | $268,000 | $93,900 |
| 2022 | $4,079 | $315,000 | $228,300 | $86,700 |
| 2021 | $3,912 | $296,600 | $218,400 | $78,200 |
| 2020 | $3,500 | $262,600 | $188,600 | $74,000 |
| 2019 | $3,457 | $258,400 | $188,600 | $69,800 |
| 2018 | $3,455 | $258,400 | $188,600 | $69,800 |
| 2017 | $3,249 | $236,800 | $178,700 | $58,100 |
| 2016 | $3,148 | $226,800 | $168,700 | $58,100 |
| 2015 | $3,017 | $227,000 | $168,700 | $58,300 |
| 2014 | $2,926 | $220,200 | $168,700 | $51,500 |
Source: Public Records
Map
Nearby Homes
- 145 Arnold Rd
- 145 Arnold Rd
- 145 Arnold Rd
- 145 Arnold Rd Winter Rental
- 147 Arnold Rd
- 141 Arnold Rd
- 151 Arnold Rd
- 132 June St
- 118 June St
- 155 Arnold Rd
- 150 Arnold Rd
- 140 Arnold Rd
- 133 Arnold Rd
- 114 June St
- 136 Arnold Rd
- 0 June St-Ext Unit 50317279
- 159 Arnold Rd
- 181 Saginaw Ave
- 158 Arnold Rd
- 132 Arnold Rd
Your Personal Tour Guide
Ask me questions while you tour the home.