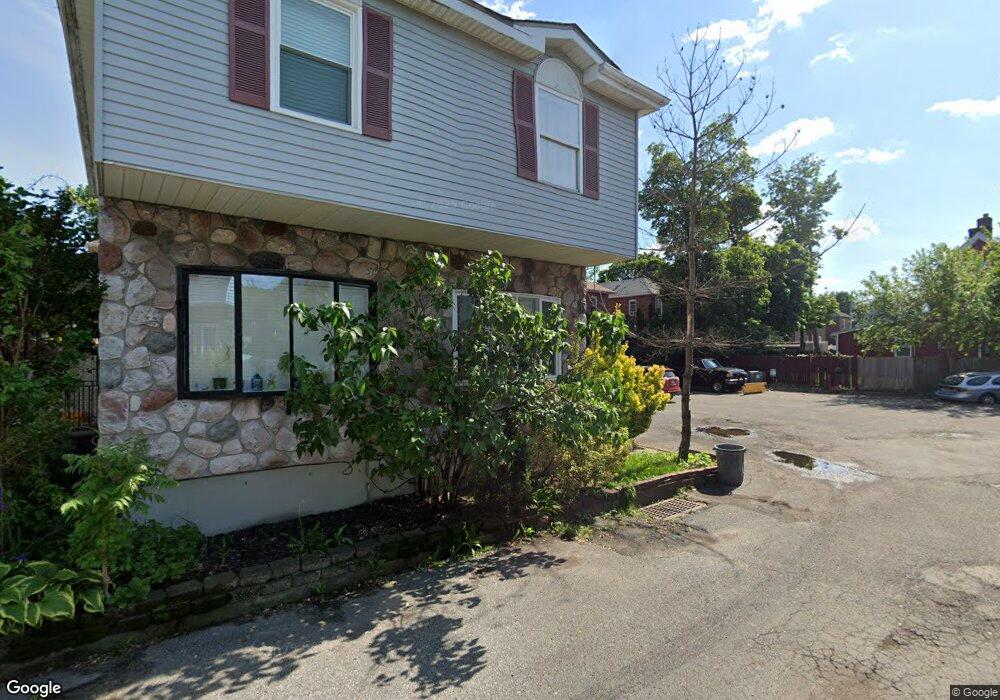
145 Bement Ct Staten Island, NY 10310
West Brighton NeighborhoodEstimated Value: $495,000 - $550,000
2
Beds
2
Baths
1,280
Sq Ft
$410/Sq Ft
Est. Value
About This Home
This home is located at 145 Bement Ct, Staten Island, NY 10310 and is currently estimated at $524,247, approximately $409 per square foot. 145 Bement Ct is a home located in Richmond County with nearby schools including P.S. 18 John G. Whittier, Intermediate School 27, and Curtis High School.
Ownership History
Date
Name
Owned For
Owner Type
Purchase Details
Closed on
Oct 31, 2008
Sold by
Dejesus Anicasio
Bought by
Dejesus Anicasio and Saez Emma L
Current Estimated Value
Purchase Details
Closed on
Mar 12, 2003
Sold by
Onofrio Harts Susan R
Bought by
Dejesus Anicasio and Dejesus Norma
Home Financials for this Owner
Home Financials are based on the most recent Mortgage that was taken out on this home.
Original Mortgage
$175,000
Interest Rate
5.84%
Mortgage Type
Purchase Money Mortgage
Purchase Details
Closed on
Mar 30, 1999
Sold by
Solebello Darleen A
Bought by
Harts Jeffrey and Harts Susan
Home Financials for this Owner
Home Financials are based on the most recent Mortgage that was taken out on this home.
Original Mortgage
$121,100
Interest Rate
7.09%
Create a Home Valuation Report for This Property
The Home Valuation Report is an in-depth analysis detailing your home's value as well as a comparison with similar homes in the area
Home Values in the Area
Average Home Value in this Area
Purchase History
| Date | Buyer | Sale Price | Title Company |
|---|---|---|---|
| Dejesus Anicasio | -- | Fidelity National Title Insu | |
| Dejesus Anicasio | $195,000 | Custom Title Services Inc | |
| Harts Jeffrey | $127,500 | Title Insurance Of Ny Inc |
Source: Public Records
Mortgage History
| Date | Status | Borrower | Loan Amount |
|---|---|---|---|
| Previous Owner | Dejesus Anicasio | $175,000 | |
| Previous Owner | Harts Jeffrey | $121,100 |
Source: Public Records
Tax History Compared to Growth
Tax History
| Year | Tax Paid | Tax Assessment Tax Assessment Total Assessment is a certain percentage of the fair market value that is determined by local assessors to be the total taxable value of land and additions on the property. | Land | Improvement |
|---|---|---|---|---|
| 2025 | $1,345 | $29,520 | $3,799 | $25,721 |
| 2024 | $1,449 | $24,120 | $4,387 | $19,733 |
| 2023 | $1,288 | $20,422 | $4,027 | $16,395 |
| 2022 | $1,264 | $22,560 | $5,040 | $17,520 |
| 2021 | $1,316 | $23,160 | $5,040 | $18,120 |
| 2020 | $1,304 | $20,400 | $5,040 | $15,360 |
| 2019 | $1,171 | $20,040 | $5,040 | $15,000 |
| 2018 | $1,076 | $17,018 | $4,267 | $12,751 |
| 2017 | $991 | $16,056 | $4,137 | $11,919 |
| 2016 | $1,605 | $16,056 | $4,800 | $11,256 |
| 2015 | $2,798 | $15,454 | $3,705 | $11,749 |
| 2014 | $2,798 | $14,580 | $4,200 | $10,380 |
Source: Public Records
Map
Nearby Homes
- 154 Pelton Ave
- 16 Howard Ct
- 188 Davis Ave
- 163 Bement Ave
- 84 Elm St
- 70 Elm St
- 154 Bard Ave Unit 14A
- 21 Elizabeth Ave
- 160 Bard Ave Unit 6A
- 11 Curtis Ct
- 144 Bard Ave Unit 25b
- 699 Henderson Ave
- 698 Henderson Ave
- 207 N Burgher Ave
- 718 Henderson Ave
- 110 Kissel Ave
- 943 Castleton Ave
- 46 Winegar Ln
- 1001 Castleton Ave
- 331 Oakland Ave