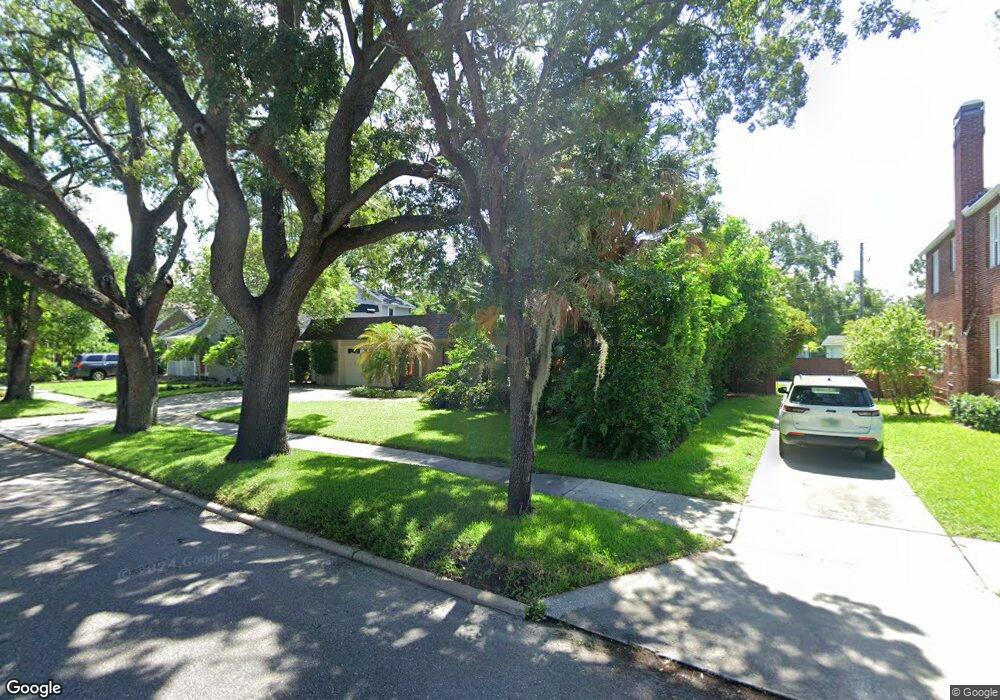
145 Bosphorous Ave Tampa, FL 33606
Davis Islands NeighborhoodEstimated Value: $1,085,637 - $1,376,000
3
Beds
3
Baths
2,344
Sq Ft
$524/Sq Ft
Est. Value
About This Home
This home is located at 145 Bosphorous Ave, Tampa, FL 33606 and is currently estimated at $1,228,409, approximately $524 per square foot. 145 Bosphorous Ave is a home located in Hillsborough County with nearby schools including Gorrie Elementary School, Wilson Middle School, and Plant High School.
Ownership History
Date
Name
Owned For
Owner Type
Purchase Details
Closed on
Mar 19, 2012
Sold by
Strickler Robert and Strickler Barbara
Bought by
Cardenas Eric D and Cardenas Andrea P
Current Estimated Value
Home Financials for this Owner
Home Financials are based on the most recent Mortgage that was taken out on this home.
Original Mortgage
$360,000
Outstanding Balance
$234,576
Interest Rate
3.12%
Mortgage Type
Adjustable Rate Mortgage/ARM
Estimated Equity
$993,833
Purchase Details
Closed on
Mar 15, 2004
Sold by
Ruisi D
Bought by
Stricker Robert and Stricker Barbara
Home Financials for this Owner
Home Financials are based on the most recent Mortgage that was taken out on this home.
Original Mortgage
$324,000
Interest Rate
5.72%
Mortgage Type
Balloon
Purchase Details
Closed on
Sep 12, 2002
Sold by
Licalsi Anthony L and Licalsi B
Bought by
Ruisi D
Home Financials for this Owner
Home Financials are based on the most recent Mortgage that was taken out on this home.
Original Mortgage
$280,000
Interest Rate
6.4%
Mortgage Type
New Conventional
Create a Home Valuation Report for This Property
The Home Valuation Report is an in-depth analysis detailing your home's value as well as a comparison with similar homes in the area
Home Values in the Area
Average Home Value in this Area
Purchase History
| Date | Buyer | Sale Price | Title Company |
|---|---|---|---|
| Cardenas Eric D | $435,000 | Bayshore Title Ins Agency | |
| Stricker Robert | $405,000 | Fuentes & Kreischer Title Co | |
| Ruisi D | $350,000 | -- |
Source: Public Records
Mortgage History
| Date | Status | Borrower | Loan Amount |
|---|---|---|---|
| Open | Cardenas Eric D | $360,000 | |
| Previous Owner | Stricker Robert | $324,000 | |
| Previous Owner | Ruisi D | $280,000 | |
| Previous Owner | Ruisi D | $180,000 |
Source: Public Records
Tax History
| Year | Tax Paid | Tax Assessment Tax Assessment Total Assessment is a certain percentage of the fair market value that is determined by local assessors to be the total taxable value of land and additions on the property. | Land | Improvement |
|---|---|---|---|---|
| 2025 | $7,831 | $451,900 | -- | -- |
| 2024 | $7,831 | $439,164 | -- | -- |
| 2023 | $7,645 | $426,373 | $0 | $0 |
| 2022 | $7,451 | $413,954 | $0 | $0 |
| 2021 | $7,368 | $401,897 | $0 | $0 |
| 2020 | $7,297 | $396,348 | $0 | $0 |
| 2019 | $7,166 | $387,437 | $0 | $0 |
| 2018 | $7,114 | $380,213 | $0 | $0 |
| 2017 | $7,015 | $423,537 | $0 | $0 |
| 2016 | $6,812 | $364,734 | $0 | $0 |
| 2015 | $6,809 | $362,199 | $0 | $0 |
| 2014 | $6,717 | $359,324 | $0 | $0 |
| 2013 | -- | $354,014 | $0 | $0 |
Source: Public Records
Map
Nearby Homes
- 214 Como St
- 128 W Davis Blvd
- 208 Danube Ave Unit 203
- 208 Danube Ave Unit 103
- 109 Biscayne Ave
- 116 W Davis Blvd
- 108 Biscayne Ave Unit B
- 166 E Davis Blvd
- 113 Bosphorous Ave Unit 2
- 114 W Targa Ct
- 143 Chesapeake Ave
- 301 Caspian St
- 114 Chesapeake Ave
- 105 Chesapeake Ave
- 98 W Davis Blvd
- 119 Huron Ave
- 238 Columbia Dr
- 201 Blanca Ave
- 18 Bahama Cir
- 420 Blanca Ave
- 143 Bosphorous Ave
- 149 Bosphorous Ave
- 152 Chippewa Ave
- 150 Chippewa Ave
- 151 Bosphorous Ave
- 139 Bosphorous Ave
- 156 Barbados Ave
- 146 Bosphorous Ave
- 140 Bosphorous Ave
- 150 Bosphorous Ave
- 138 Bosphorous Ave
- 162 Barbados Ave
- 152 Bosphorous Ave
- 144 Chippewa Ave
- 154 Bosphorous Ave
- 157 Bosphorous Ave
- 136 Bosphorous Ave
- 137 Bosphorous Ave
- 139 W Davis Blvd
- 145 W Davis Blvd
Your Personal Tour Guide
Ask me questions while you tour the home.