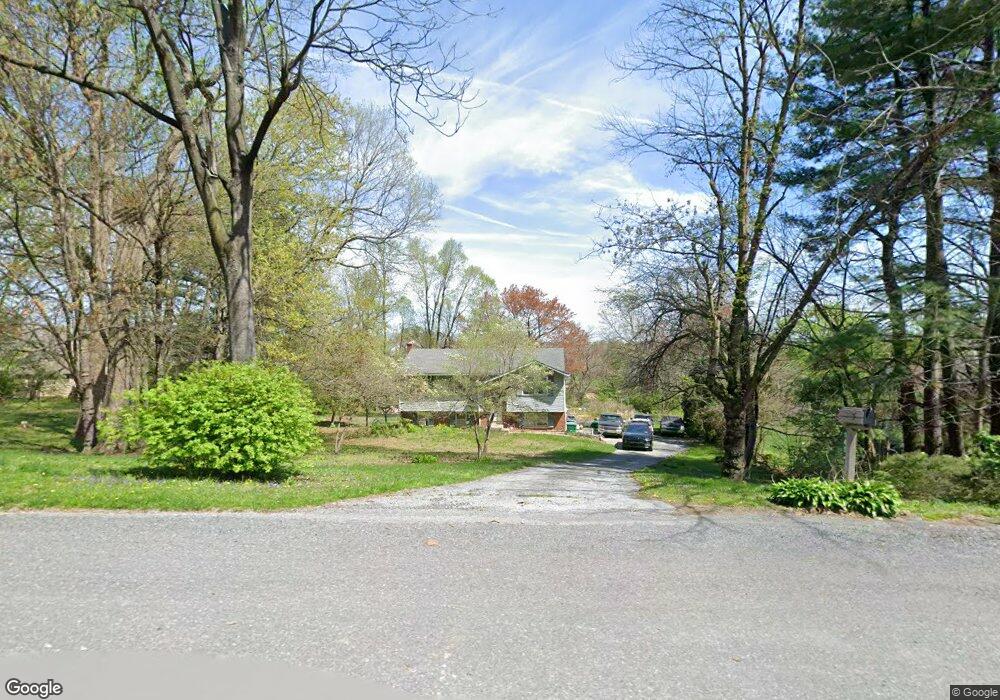
145 Clover Hill Rd Christiana, PA 17509
Estimated Value: $296,000 - $383,000
3
Beds
2
Baths
1,086
Sq Ft
$315/Sq Ft
Est. Value
About This Home
This home is located at 145 Clover Hill Rd, Christiana, PA 17509 and is currently estimated at $342,560, approximately $315 per square foot. 145 Clover Hill Rd is a home located in Lancaster County with nearby schools including Smith Middle School and Solanco High School.
Ownership History
Date
Name
Owned For
Owner Type
Purchase Details
Closed on
May 31, 2007
Sold by
Parsons Lester E and Parsons Carole
Bought by
Whitney Brian and Lambert Megan
Current Estimated Value
Home Financials for this Owner
Home Financials are based on the most recent Mortgage that was taken out on this home.
Original Mortgage
$167,900
Outstanding Balance
$102,626
Interest Rate
6.17%
Mortgage Type
Purchase Money Mortgage
Estimated Equity
$239,934
Purchase Details
Closed on
May 26, 2000
Sold by
Hud
Bought by
Parsons Lester E and Parsons Carole
Home Financials for this Owner
Home Financials are based on the most recent Mortgage that was taken out on this home.
Original Mortgage
$97,529
Interest Rate
8.14%
Mortgage Type
FHA
Purchase Details
Closed on
Nov 5, 1999
Sold by
Commercial Federal Mtg Corp
Bought by
Hud
Purchase Details
Closed on
Sep 22, 1999
Sold by
Scholl William R and Scholl Stacey T
Bought by
Commercial Federal Mtg Corp
Create a Home Valuation Report for This Property
The Home Valuation Report is an in-depth analysis detailing your home's value as well as a comparison with similar homes in the area
Home Values in the Area
Average Home Value in this Area
Purchase History
| Date | Buyer | Sale Price | Title Company |
|---|---|---|---|
| Whitney Brian | $209,900 | None Available | |
| Parsons Lester E | $97,520 | Fidelity National Title Ins | |
| Hud | -- | -- | |
| Commercial Federal Mtg Corp | $3,814 | -- |
Source: Public Records
Mortgage History
| Date | Status | Borrower | Loan Amount |
|---|---|---|---|
| Open | Whitney Brian | $167,900 | |
| Previous Owner | Parsons Lester E | $97,529 |
Source: Public Records
Tax History Compared to Growth
Tax History
| Year | Tax Paid | Tax Assessment Tax Assessment Total Assessment is a certain percentage of the fair market value that is determined by local assessors to be the total taxable value of land and additions on the property. | Land | Improvement |
|---|---|---|---|---|
| 2025 | $2,647 | $163,600 | $54,600 | $109,000 |
| 2024 | $2,647 | $163,600 | $54,600 | $109,000 |
| 2023 | $2,484 | $163,600 | $54,600 | $109,000 |
| 2022 | $2,410 | $163,600 | $54,600 | $109,000 |
| 2021 | $2,325 | $163,600 | $54,600 | $109,000 |
| 2020 | $2,325 | $163,600 | $54,600 | $109,000 |
| 2019 | $2,265 | $163,600 | $54,600 | $109,000 |
| 2018 | $554 | $163,600 | $54,600 | $109,000 |
| 2017 | $2,127 | $126,700 | $38,400 | $88,300 |
| 2016 | $2,127 | $126,700 | $38,400 | $88,300 |
| 2015 | $549 | $126,700 | $38,400 | $88,300 |
| 2014 | $1,496 | $126,700 | $38,400 | $88,300 |
Source: Public Records
Map
Nearby Homes
- 771 Georgetown Rd
- 110 Dawn St
- 11 Fernwood Dr
- 80 Paradise Ln
- 46 Rineer Dr
- 161 Groff Rd
- 120 Ola Way
- 20 S Kinzer Rd
- 0 Ola Way Unit PALA2065804
- 12 S Kinzer Rd
- 936 Gap Rd
- 5412 Strasburg Rd
- 6 N Kinzer Rd
- 13 Linden Ave
- 0 N Kinzer Rd
- 35 N Kinzer Rd
- 5232 Meadow Ln
- 125 Reservoir Rd
- 43 Gay St
- 909 Hidden Hollow Dr
- 141 Clover Hill Rd
- 149 Clover Hill Rd
- 31 Regency Dr
- 137 Clover Hill Rd
- 160 Clover Hill Rd
- 153 Clover Hill Rd
- 29 Regency Dr
- 133 Clover Hill Rd
- 27 Regency Dr
- 132 Clover Hill Rd
- 129 Clover Hill Rd
- 19 Jasper Ln
- 17 Jasper Ln
- 15 Jasper Ln
- 13 Jasper Ln
- 126 Clover Hill Rd
- 28 Regency Dr
- 125 Clover Hill Rd
- 16 Jasper Ln
- 18 Jasper Ln