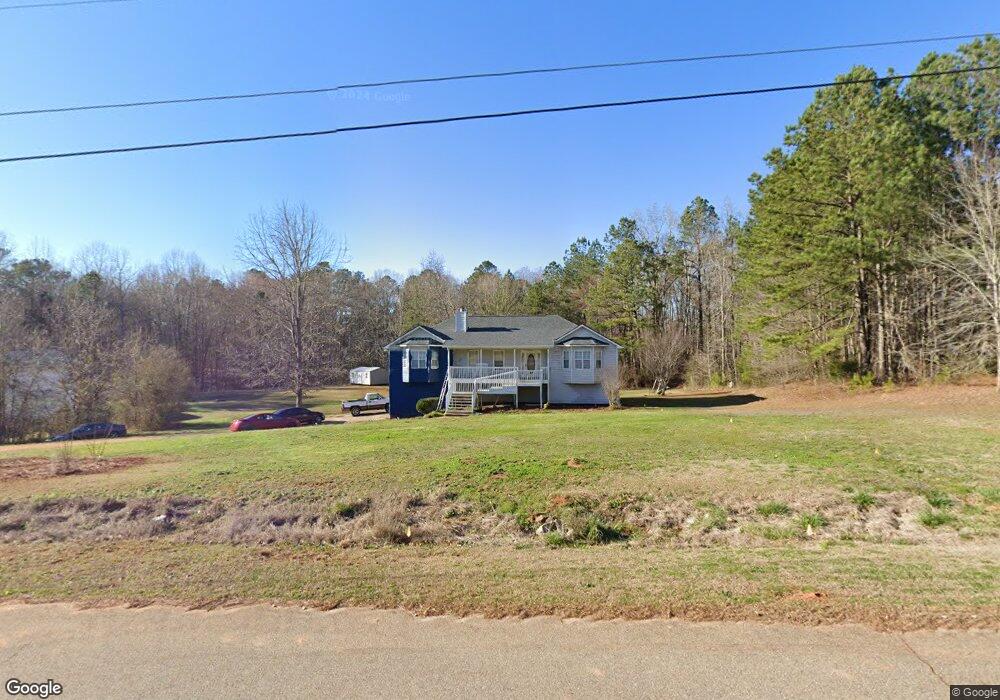
145 Creekside Way McDonough, GA 30252
Estimated Value: $295,000 - $315,000
3
Beds
3
Baths
1,865
Sq Ft
$163/Sq Ft
Est. Value
About This Home
This home is located at 145 Creekside Way, McDonough, GA 30252 and is currently estimated at $304,225, approximately $163 per square foot. 145 Creekside Way is a home located in Henry County with nearby schools including New Hope Elementary School, Locust Grove Middle School, and Locust Grove High School.
Ownership History
Date
Name
Owned For
Owner Type
Purchase Details
Closed on
Apr 28, 2020
Sold by
Sherling Mark E
Bought by
Pease Valerie Ann
Current Estimated Value
Home Financials for this Owner
Home Financials are based on the most recent Mortgage that was taken out on this home.
Original Mortgage
$186,480
Outstanding Balance
$164,885
Interest Rate
3.3%
Mortgage Type
VA
Estimated Equity
$139,340
Purchase Details
Closed on
Nov 19, 2004
Sold by
Sherling Mark E
Bought by
Sherling Mark E and Sherling Karol
Purchase Details
Closed on
Jun 22, 2001
Sold by
Sherling Mark E
Bought by
Sherling Mark E and Sherling Karol
Home Financials for this Owner
Home Financials are based on the most recent Mortgage that was taken out on this home.
Original Mortgage
$126,850
Interest Rate
7.09%
Mortgage Type
FHA
Purchase Details
Closed on
May 8, 1995
Sold by
Fincher Donald
Bought by
Snyder J Richard Patricia
Create a Home Valuation Report for This Property
The Home Valuation Report is an in-depth analysis detailing your home's value as well as a comparison with similar homes in the area
Home Values in the Area
Average Home Value in this Area
Purchase History
| Date | Buyer | Sale Price | Title Company |
|---|---|---|---|
| Pease Valerie Ann | $180,000 | -- | |
| Sherling Mark E | -- | -- | |
| Sherling Mark E | -- | -- | |
| Sherling Mark E | $150,000 | -- | |
| Snyder J Richard Patricia | $104,500 | -- |
Source: Public Records
Mortgage History
| Date | Status | Borrower | Loan Amount |
|---|---|---|---|
| Open | Pease Valerie Ann | $186,480 | |
| Previous Owner | Sherling Mark E | $126,850 | |
| Closed | Snyder J Richard Patricia | $0 |
Source: Public Records
Tax History Compared to Growth
Tax History
| Year | Tax Paid | Tax Assessment Tax Assessment Total Assessment is a certain percentage of the fair market value that is determined by local assessors to be the total taxable value of land and additions on the property. | Land | Improvement |
|---|---|---|---|---|
| 2025 | $5,170 | $129,768 | $16,000 | $113,768 |
| 2024 | $5,170 | $135,400 | $16,000 | $119,400 |
| 2023 | $5,027 | $130,000 | $14,000 | $116,000 |
| 2022 | $3,884 | $100,200 | $14,000 | $86,200 |
| 2021 | $2,802 | $72,000 | $11,664 | $60,336 |
| 2020 | $2,427 | $73,680 | $12,000 | $61,680 |
| 2019 | $2,250 | $66,240 | $12,000 | $54,240 |
| 2018 | $2,270 | $67,080 | $10,800 | $56,280 |
| 2016 | $1,972 | $57,440 | $10,000 | $47,440 |
| 2015 | $1,843 | $52,880 | $8,000 | $44,880 |
| 2014 | $1,770 | $50,600 | $8,000 | $42,600 |
Source: Public Records
Map
Nearby Homes
- 151 River Park Cir
- 845 Graeme Dr
- 812 Graeme Dr
- 225 Laney Ct
- 767 Old Jackson Rd
- 175 Laney Ct Unit 1
- 215 Laney Rd
- 125 Laney Ct
- 125 Karen Dr
- 995 Old Jackson Rd
- 281 Laney Dr
- 461 Old Jackson Rd
- 153 Hilda Way
- 136 Hilda Way
- 315 S Bethany Rd
- 275 S Bethany Rd
- 2563 Highway 81 E
- 121, 125, 129 Case Dr
- 1126 Old Jackson Rd
- 705 S Bethany Rd
- 135 Creekside Way
- 155 Creekside Way
- 140 Creekside Way
- 130 Creekside Way
- 125 Creekside Way
- 165 Creekside Way
- 120 Creekside Way Unit 2
- 154 River Park Cir
- 180 Creekside Way
- 152 River Park Cir
- 175 Creekside Way
- 1350 Carney Ct
- 115 Creekside Way
- 1355 Carney Ct
- 150 River Park Cir
- 100 Creekside Way
- 158 River Park Cir
- 185 Creekside Way
- 148 River Park Cir
- 157 River Park Cir