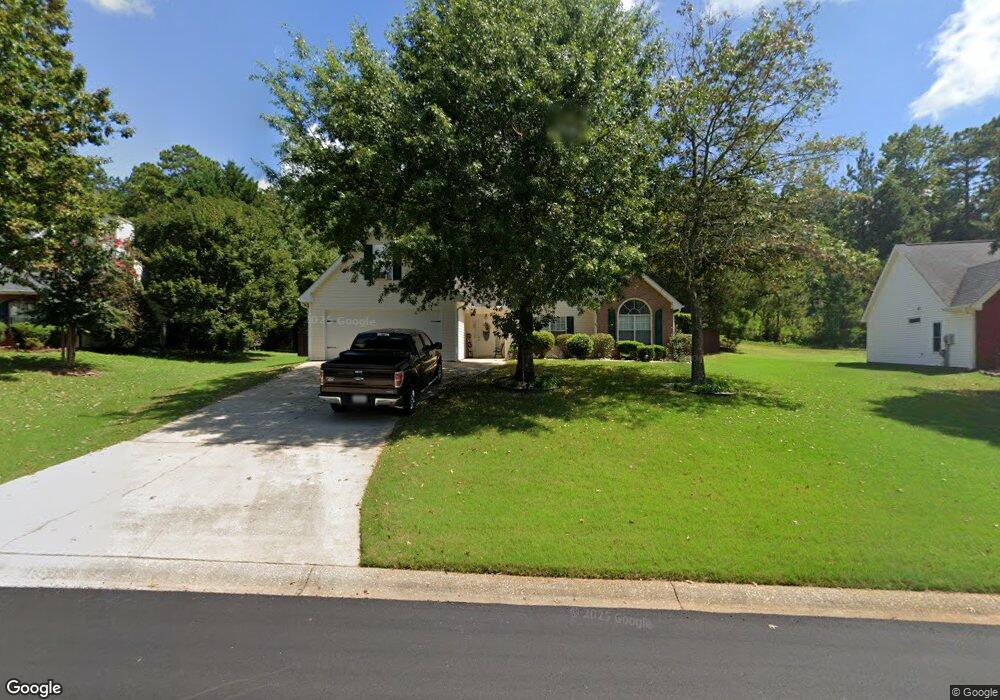
145 Deep Springs Way Covington, GA 30016
Estimated Value: $281,000 - $318,000
4
Beds
2
Baths
2,081
Sq Ft
$146/Sq Ft
Est. Value
About This Home
This home is located at 145 Deep Springs Way, Covington, GA 30016 and is currently estimated at $303,354, approximately $145 per square foot. 145 Deep Springs Way is a home located in Newton County with nearby schools including Live Oak Elementary School, Veterans Memorial Middle School, and Newton High School.
Ownership History
Date
Name
Owned For
Owner Type
Purchase Details
Closed on
Nov 14, 2013
Sold by
Jaime Noe
Bought by
Jaime-Sanchez Jose A
Current Estimated Value
Purchase Details
Closed on
Aug 23, 2010
Sold by
Bank Of New Sami Ii 2006-Ar3
Bought by
Jaime Noe
Purchase Details
Closed on
Dec 2, 2008
Sold by
Turner Marketa
Bought by
Bank Of New York Sami Ii 2006-
Purchase Details
Closed on
Sep 29, 2003
Sold by
Blazquez Carlos and Blazquez Wendy A
Bought by
Turner Marketa
Home Financials for this Owner
Home Financials are based on the most recent Mortgage that was taken out on this home.
Original Mortgage
$132,525
Interest Rate
9%
Mortgage Type
New Conventional
Purchase Details
Closed on
Dec 30, 1998
Sold by
Freeman Builders Inc
Bought by
Blazquez Carlos
Home Financials for this Owner
Home Financials are based on the most recent Mortgage that was taken out on this home.
Original Mortgage
$110,850
Interest Rate
6.84%
Mortgage Type
New Conventional
Create a Home Valuation Report for This Property
The Home Valuation Report is an in-depth analysis detailing your home's value as well as a comparison with similar homes in the area
Home Values in the Area
Average Home Value in this Area
Purchase History
| Date | Buyer | Sale Price | Title Company |
|---|---|---|---|
| Jaime-Sanchez Jose A | -- | -- | |
| Jaime Noe | $46,900 | -- | |
| Bank Of New York Sami Ii 2006- | $135,900 | -- | |
| Turner Marketa | $139,500 | -- | |
| Blazquez Carlos | $116,800 | -- |
Source: Public Records
Mortgage History
| Date | Status | Borrower | Loan Amount |
|---|---|---|---|
| Previous Owner | Turner Marketa | $132,525 | |
| Previous Owner | Blazquez Carlos | $110,850 |
Source: Public Records
Tax History Compared to Growth
Tax History
| Year | Tax Paid | Tax Assessment Tax Assessment Total Assessment is a certain percentage of the fair market value that is determined by local assessors to be the total taxable value of land and additions on the property. | Land | Improvement |
|---|---|---|---|---|
| 2024 | $2,821 | $112,960 | $16,800 | $96,160 |
| 2023 | $3,119 | $116,720 | $7,200 | $109,520 |
| 2022 | $2,509 | $94,240 | $7,200 | $87,040 |
| 2021 | $2,228 | $75,480 | $7,200 | $68,280 |
| 2020 | $2,247 | $69,200 | $7,200 | $62,000 |
| 2019 | $2,215 | $67,280 | $7,200 | $60,080 |
| 2018 | $2,014 | $61,000 | $7,200 | $53,800 |
| 2017 | $1,673 | $51,080 | $7,200 | $43,880 |
| 2016 | $1,418 | $43,640 | $5,200 | $38,440 |
| 2015 | $1,220 | $37,920 | $5,200 | $32,720 |
| 2014 | $924 | $29,320 | $0 | $0 |
Source: Public Records
Map
Nearby Homes
- 135 Deep Springs Way Unit 1
- 155 Deep Springs Way
- 125 Deep Springs Way Unit 1
- 150 Deep Springs Way Unit 1
- 165 Deep Springs Way
- 130 Deep Springs Way Unit 1
- 40 Overlook Dr
- 160 Deep Springs Way Unit 1
- 115 Deep Springs Way
- 110 Deep Springs Way Unit 2
- 80 Overlook Dr
- 80 Overlook Dr Unit 200
- 20 Overlook Dr
- 25 Rock Wood Ct
- 25 Rock Wood Ct Unit 2
- 105 Deep Springs Way
- 510 Womack Rd
- 185 Deep Springs Way
- 35 Overlook Dr
- 180 Deep Springs Way