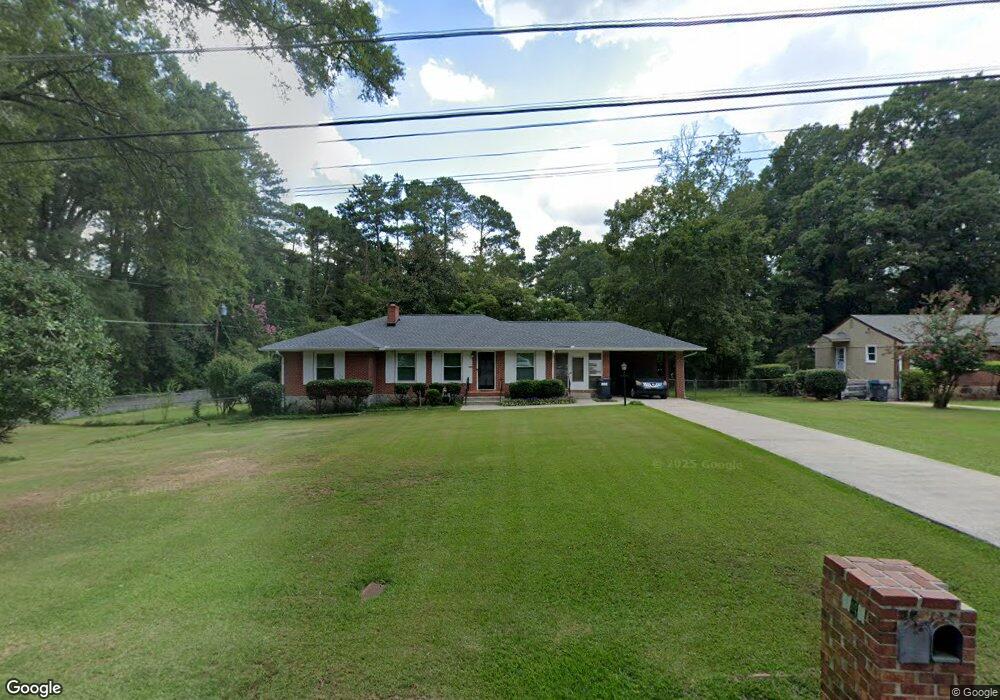
145 Dixon St Jonesboro, GA 30236
Estimated Value: $211,359 - $262,000
3
Beds
2
Baths
1,840
Sq Ft
$125/Sq Ft
Est. Value
About This Home
This home is located at 145 Dixon St, Jonesboro, GA 30236 and is currently estimated at $229,840, approximately $124 per square foot. 145 Dixon St is a home located in Clayton County with nearby schools including Lee Street Elementary School, Jonesboro Middle School, and Jonesboro High School.
Ownership History
Date
Name
Owned For
Owner Type
Purchase Details
Closed on
Dec 29, 2008
Sold by
Petersen Christopher L
Bought by
Vidal Patricio and Satcher Anna
Current Estimated Value
Home Financials for this Owner
Home Financials are based on the most recent Mortgage that was taken out on this home.
Original Mortgage
$84,441
Outstanding Balance
$55,529
Interest Rate
5.95%
Mortgage Type
FHA
Estimated Equity
$174,311
Purchase Details
Closed on
Mar 6, 2001
Sold by
Petersen Nicole
Bought by
Petersen Christopher L
Purchase Details
Closed on
Aug 26, 1998
Sold by
Miller Linda T
Bought by
Petersen Christopher and Petersen Nicol
Home Financials for this Owner
Home Financials are based on the most recent Mortgage that was taken out on this home.
Original Mortgage
$94,350
Interest Rate
6.92%
Mortgage Type
VA
Purchase Details
Closed on
Jul 25, 1995
Sold by
Brown Ronald C Violet G
Bought by
Miller Linda T
Create a Home Valuation Report for This Property
The Home Valuation Report is an in-depth analysis detailing your home's value as well as a comparison with similar homes in the area
Home Values in the Area
Average Home Value in this Area
Purchase History
| Date | Buyer | Sale Price | Title Company |
|---|---|---|---|
| Vidal Patricio | $84,900 | -- | |
| Petersen Christopher L | -- | -- | |
| Petersen Christopher | $92,500 | -- | |
| Miller Linda T | $87,900 | -- |
Source: Public Records
Mortgage History
| Date | Status | Borrower | Loan Amount |
|---|---|---|---|
| Open | Vidal Patricio | $84,441 | |
| Previous Owner | Petersen Christopher | $94,350 |
Source: Public Records
Tax History Compared to Growth
Tax History
| Year | Tax Paid | Tax Assessment Tax Assessment Total Assessment is a certain percentage of the fair market value that is determined by local assessors to be the total taxable value of land and additions on the property. | Land | Improvement |
|---|---|---|---|---|
| 2024 | $2,406 | $71,680 | $7,200 | $64,480 |
| 2023 | $2,356 | $65,240 | $7,200 | $58,040 |
| 2022 | $1,688 | $53,000 | $7,200 | $45,800 |
| 2021 | $1,441 | $46,480 | $7,200 | $39,280 |
| 2020 | $1,046 | $36,162 | $7,200 | $28,962 |
| 2019 | $1,011 | $34,900 | $5,600 | $29,300 |
| 2018 | $914 | $32,503 | $5,600 | $26,903 |
| 2017 | $579 | $24,236 | $5,600 | $18,636 |
| 2016 | $555 | $23,633 | $5,600 | $18,033 |
| 2015 | $546 | $0 | $0 | $0 |
| 2014 | $412 | $20,341 | $5,600 | $14,741 |
Source: Public Records
Map
Nearby Homes