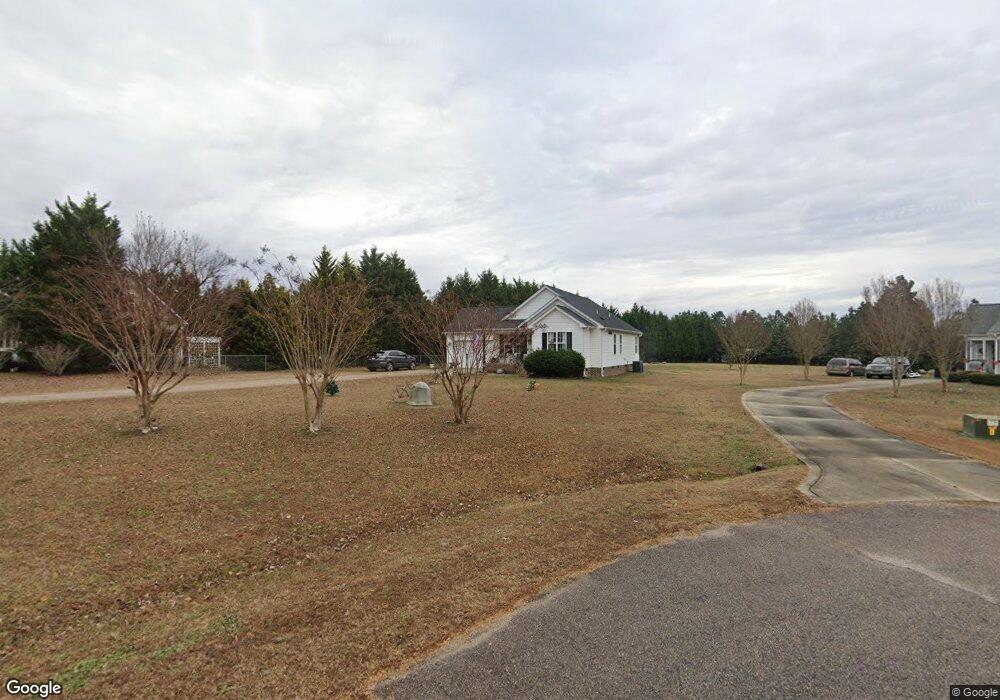
145 Gray Bass Ct Zebulon, NC 27597
Estimated Value: $287,000 - $321,000
3
Beds
2
Baths
1,274
Sq Ft
$240/Sq Ft
Est. Value
About This Home
This home is located at 145 Gray Bass Ct, Zebulon, NC 27597 and is currently estimated at $305,893, approximately $240 per square foot. 145 Gray Bass Ct is a home located in Franklin County with nearby schools including Bunn Elementary School, Bunn Middle School, and Bunn High School.
Ownership History
Date
Name
Owned For
Owner Type
Purchase Details
Closed on
Jul 1, 2021
Sold by
Ford William D
Bought by
Alford Audrey E
Current Estimated Value
Purchase Details
Closed on
Dec 8, 2019
Sold by
Doliner Jerry and Doliner Polly
Bought by
Alford Audrey E and Ford William D
Home Financials for this Owner
Home Financials are based on the most recent Mortgage that was taken out on this home.
Original Mortgage
$182,000
Outstanding Balance
$162,791
Interest Rate
4.37%
Mortgage Type
New Conventional
Estimated Equity
$143,102
Purchase Details
Closed on
Jun 4, 2012
Sold by
Tcgi Inc
Bought by
Doliner Jerry and Doliner Polly
Purchase Details
Closed on
Dec 27, 2006
Sold by
Doliner Jerry and Doliner Polly
Bought by
Tcgi Inc
Purchase Details
Closed on
Feb 27, 2006
Sold by
Jvc Homes Inc
Bought by
Doliner Jerry
Home Financials for this Owner
Home Financials are based on the most recent Mortgage that was taken out on this home.
Original Mortgage
$105,400
Interest Rate
6.04%
Mortgage Type
New Conventional
Create a Home Valuation Report for This Property
The Home Valuation Report is an in-depth analysis detailing your home's value as well as a comparison with similar homes in the area
Home Values in the Area
Average Home Value in this Area
Purchase History
| Date | Buyer | Sale Price | Title Company |
|---|---|---|---|
| Alford Audrey E | -- | None Available | |
| Alford Audrey E | $180,000 | None Available | |
| Doliner Jerry | -- | None Available | |
| Tcgi Inc | -- | None Available | |
| Doliner Jerry | $132,000 | None Available |
Source: Public Records
Mortgage History
| Date | Status | Borrower | Loan Amount |
|---|---|---|---|
| Open | Alford Audrey E | $182,000 | |
| Previous Owner | Doliner Jerry | $105,400 |
Source: Public Records
Tax History Compared to Growth
Tax History
| Year | Tax Paid | Tax Assessment Tax Assessment Total Assessment is a certain percentage of the fair market value that is determined by local assessors to be the total taxable value of land and additions on the property. | Land | Improvement |
|---|---|---|---|---|
| 2024 | $1,694 | $280,410 | $73,500 | $206,910 |
| 2023 | $1,440 | $155,500 | $33,000 | $122,500 |
| 2022 | $1,406 | $155,500 | $33,000 | $122,500 |
| 2021 | $1,422 | $155,500 | $33,000 | $122,500 |
| 2020 | $1,431 | $155,500 | $33,000 | $122,500 |
| 2019 | $1,421 | $155,500 | $33,000 | $122,500 |
| 2018 | $1,416 | $155,500 | $33,000 | $122,500 |
| 2017 | $1,330 | $134,390 | $30,000 | $104,390 |
| 2016 | $1,377 | $134,390 | $30,000 | $104,390 |
| 2015 | $1,377 | $134,390 | $30,000 | $104,390 |
| 2014 | $1,281 | $134,390 | $30,000 | $104,390 |
Source: Public Records
Map
Nearby Homes
- 305 Leghorn Dr
- 45 Addison Pond Ct
- 46 Addison Pond Ct
- Lot 6 Triskel Ln
- 8420 Hopkins Glen Way
- Lot 5 Triskel
- 5008 Hopkins Chapel Rd
- 5009 Hopkins Chapel Rd
- 25 Diamond Creek Dr
- 8524 Pascolo Way
- 15 Diamond Creek Dr
- 20 Diamond Creek Dr
- 105 Perry Ln
- Dunlin Plan at Kettle Creek
- Tryon Plan at Kettle Creek
- Fuller Plan at Kettle Creek
- Jasmine Plan at Kettle Creek
- Eleanor Plan at Kettle Creek
- Tundra Plan at Kettle Creek
- Sandpiper Plan at Kettle Creek
- 115 Gray Bass Ct
- 155 Gray Bass Ct
- 135 Leghorn Dr
- 160 Gray Bass Ct
- 150 Gray Bass Ct
- 125 Leghorn Dr
- 130 Gray Bass Ct
- 120 Gray Bass Ct
- 105 Gray Bass Ct
- 115 Leghorn Dr
- 110 Gray Bass Ct
- 40 Old Pond Ct
- 100 Gray Bass Ct
- 95 Leghorn Dr
- 45 Old Pond Ct
- 90 Gray Bass Ct
- 000 Leghorn Dr
- 85 Leghorn Dr
- 140 Leghorn Dr
- 130 Leghorn Dr