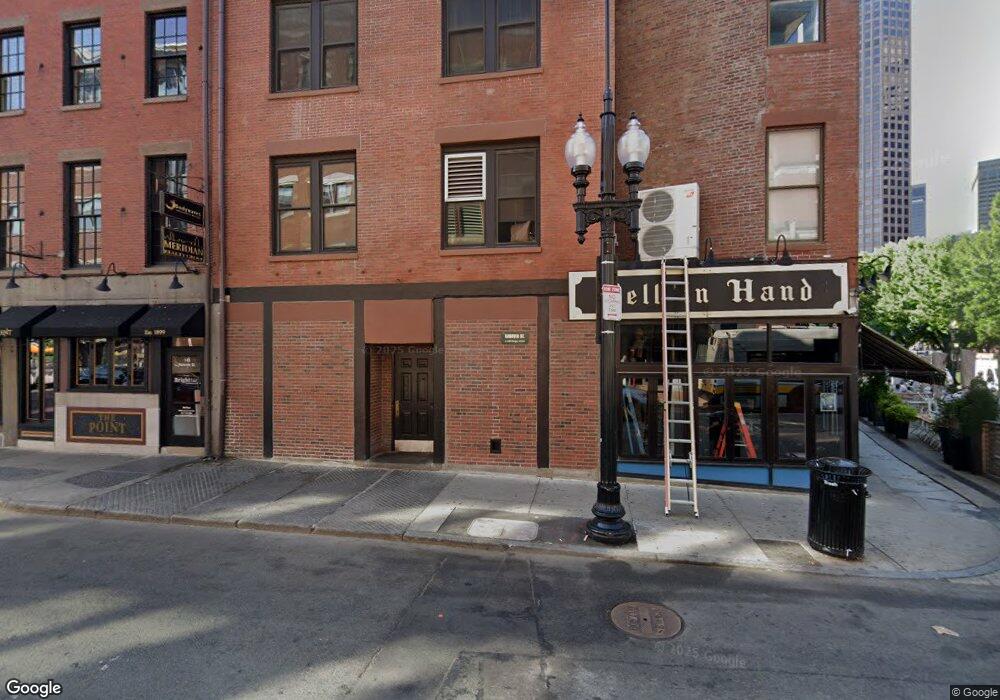
145 Hanover St Unit 4 Boston, MA 02108
Downtown Boston NeighborhoodEstimated Value: $4,519,403
--
Bed
--
Bath
6,870
Sq Ft
$658/Sq Ft
Est. Value
About This Home
This home is located at 145 Hanover St Unit 4, Boston, MA 02108 and is currently estimated at $4,519,403, approximately $657 per square foot. 145 Hanover St Unit 4 is a home located in Suffolk County with nearby schools including Bridge Boston Charter School, Edward M. Kennedy Academy for Health Careers, and Torit Montessori School.
Ownership History
Date
Name
Owned For
Owner Type
Purchase Details
Closed on
Sep 3, 1998
Sold by
Naples Rt
Bought by
Hanover 145 Street Rt
Current Estimated Value
Home Financials for this Owner
Home Financials are based on the most recent Mortgage that was taken out on this home.
Original Mortgage
$640,000
Outstanding Balance
$136,713
Interest Rate
6.9%
Mortgage Type
Commercial
Estimated Equity
$4,382,690
Create a Home Valuation Report for This Property
The Home Valuation Report is an in-depth analysis detailing your home's value as well as a comparison with similar homes in the area
Home Values in the Area
Average Home Value in this Area
Purchase History
| Date | Buyer | Sale Price | Title Company |
|---|---|---|---|
| Hanover 145 Street Rt | $905,000 | -- |
Source: Public Records
Mortgage History
| Date | Status | Borrower | Loan Amount |
|---|---|---|---|
| Open | Hanover 145 Street Rt | $640,000 |
Source: Public Records
Tax History Compared to Growth
Tax History
| Year | Tax Paid | Tax Assessment Tax Assessment Total Assessment is a certain percentage of the fair market value that is determined by local assessors to be the total taxable value of land and additions on the property. | Land | Improvement |
|---|---|---|---|---|
| 2025 | $48,400 | $1,864,400 | $599,200 | $1,265,200 |
| 2024 | $50,977 | $2,017,300 | $599,200 | $1,418,100 |
| 2023 | $50,631 | $2,051,500 | $599,200 | $1,452,300 |
| 2022 | $41,859 | $1,675,700 | $599,200 | $1,076,500 |
| 2021 | $42,005 | $1,711,000 | $530,100 | $1,180,900 |
| 2020 | $40,744 | $1,635,000 | $530,100 | $1,104,900 |
| 2019 | $40,125 | $1,605,000 | $530,100 | $1,074,900 |
| 2018 | $39,451 | $1,565,500 | $520,200 | $1,045,300 |
| 2017 | $39,311 | $1,549,500 | $495,400 | $1,054,100 |
| 2016 | $42,628 | $1,590,000 | $459,100 | $1,130,900 |
| 2015 | $31,631 | $1,071,500 | $247,700 | $823,800 |
| 2014 | $31,710 | $1,017,000 | $214,700 | $802,300 |
Source: Public Records
Map
Nearby Homes
- 110 Sudbury St Unit 3604
- 110 Sudbury St Unit 3605
- 110 Sudbury St Unit 4002
- 110 Sudbury St Unit 4105
- 110 Sudbury St Unit 3601
- 26 Stillman St Unit 3-2
- 43 Stillman St Unit PH
- 43 Stillman St Unit 1
- 11 Wiget St Unit 11-4
- 110-112 Commercial St Unit 2
- 110-112 Commercial St Unit 5
- 115 Salem St Unit 16
- 6 Baldwin Place
- 142 Commercial St Unit 503
- 62 N Margin St Unit 1
- 133 Salem St
- 121 Portland St Unit 605
- 121 Portland St Unit 902
- 121 Portland St Unit 505
- 126 Salem St Unit 3
- 55 Union St
- 7 Marshall St Unit 501
- 7 Marshall St Unit 502
- 7 Marshall St Unit 402
- 7 Marshall St Unit 401
- 7 Marshall St Unit 403
- 7 Marshall St Unit 503
- 7 Marshall St
- 120 Blackstone St Unit 401
- 120 Blackstone St Unit 403
- 120 Blackstone St Unit 503
- 120 Blackstone St Unit 501
- 120 Blackstone St
- 108 Blackstone St Unit 112
- 100 Blackstone St
- 106 Blackstone St
- 37 Union St Unit 5
- 37 Union St Unit 3
- 37 Union St Unit 4
- 37 Union St Unit 2