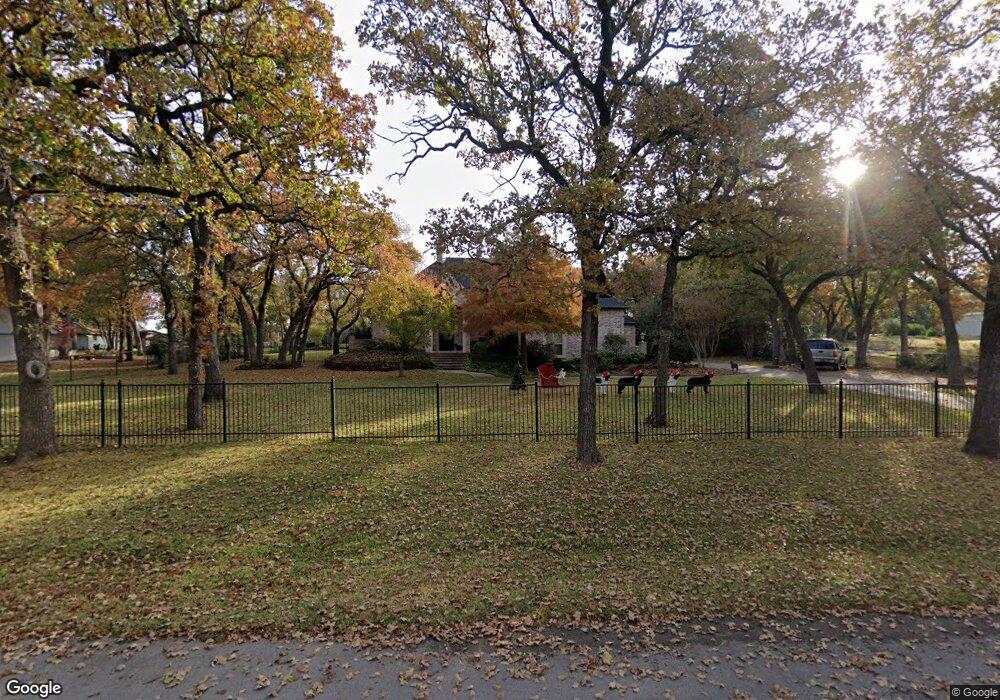
145 Jellico Cir Southlake, TX 76092
Estimated Value: $1,180,027 - $1,558,000
4
Beds
3
Baths
3,896
Sq Ft
$355/Sq Ft
Est. Value
About This Home
This home is located at 145 Jellico Cir, Southlake, TX 76092 and is currently estimated at $1,383,507, approximately $355 per square foot. 145 Jellico Cir is a home located in Tarrant County with nearby schools including Florence Elementary School, Bear Creek Intermediate School, and Keller Middle School.
Ownership History
Date
Name
Owned For
Owner Type
Purchase Details
Closed on
May 8, 2015
Sold by
Parks David A and Parks Nora L
Bought by
Smith Martin Stephen Lee and Smith Martin Nan
Current Estimated Value
Home Financials for this Owner
Home Financials are based on the most recent Mortgage that was taken out on this home.
Original Mortgage
$400,000
Outstanding Balance
$308,815
Interest Rate
3.74%
Mortgage Type
Purchase Money Mortgage
Estimated Equity
$1,074,692
Purchase Details
Closed on
Nov 30, 2004
Sold by
Casey Joe A and Casey Winnie Sue
Bought by
Parks David A and Parks Nora L
Home Financials for this Owner
Home Financials are based on the most recent Mortgage that was taken out on this home.
Original Mortgage
$117,000
Interest Rate
5.64%
Mortgage Type
Purchase Money Mortgage
Create a Home Valuation Report for This Property
The Home Valuation Report is an in-depth analysis detailing your home's value as well as a comparison with similar homes in the area
Home Values in the Area
Average Home Value in this Area
Purchase History
| Date | Buyer | Sale Price | Title Company |
|---|---|---|---|
| Smith Martin Stephen Lee | -- | None Available | |
| Parks David A | -- | Metroplex Title Inc |
Source: Public Records
Mortgage History
| Date | Status | Borrower | Loan Amount |
|---|---|---|---|
| Open | Smith Martin Stephen Lee | $400,000 | |
| Previous Owner | Parks David A | $117,000 |
Source: Public Records
Tax History Compared to Growth
Tax History
| Year | Tax Paid | Tax Assessment Tax Assessment Total Assessment is a certain percentage of the fair market value that is determined by local assessors to be the total taxable value of land and additions on the property. | Land | Improvement |
|---|---|---|---|---|
| 2025 | $6,942 | $1,044,523 | $432,590 | $611,933 |
| 2024 | $6,942 | $1,044,523 | $432,590 | $611,933 |
| 2023 | $13,965 | $1,033,153 | $432,590 | $600,563 |
| 2022 | $14,718 | $912,681 | $307,590 | $605,091 |
| 2021 | $14,449 | $605,000 | $307,590 | $297,410 |
| 2020 | $14,562 | $605,000 | $307,590 | $297,410 |
| 2019 | $15,437 | $605,000 | $307,590 | $297,410 |
| 2018 | $10,396 | $717,873 | $120,819 | $597,054 |
| 2017 | $17,024 | $652,612 | $120,819 | $531,793 |
| 2016 | $17,608 | $675,000 | $100,000 | $575,000 |
| 2015 | $9,773 | $504,922 | $100,000 | $404,922 |
| 2014 | $9,773 | $385,200 | $100,000 | $285,200 |
Source: Public Records
Map
Nearby Homes
- 146 Jellico Cir
- 127 Jellico Cir
- 2740 W Southlake Blvd
- 2608 W Southlake Blvd
- 2655 Johnson Rd
- 3095 Johnson Rd
- 112 Stony Brook Way
- 605 Royal Ln
- 600 Overland Trail
- 275 Timberline Ln
- 351 Watermere Dr
- 3210 Gray Ln
- 2636 Park Grove Loop
- 404 Branding Iron Ct
- 2525 Park Grove Loop
- 365 Watermere Dr
- 301 Watermere Dr Unit 401
- 301 Watermere Dr Unit 216
- 2620 Park Grove Loop
- 2616 Park Grove Loop
- 143 Jellico Cir
- 155 Jellico Cir
- 134 Jellico Cir
- 155 Jellico Cir W
- 152 Jellico Cir
- 137 Jellico Cir
- 130 Jellico Cir
- 126 Jellico Cir
- 144 Jellico Cir
- 163 Jellico Cir
- 140 Jellico Cir
- 158 Jellico Cir
- 122 Jellico Cir
- 162 Jellico Cir
- 135 Jellico Cir
- 118 Jellico Cir
- 180 Jellico Cir
- 167 Jellico Cir
- 2945 Johnson Rd
- 2935 Johnson Rd