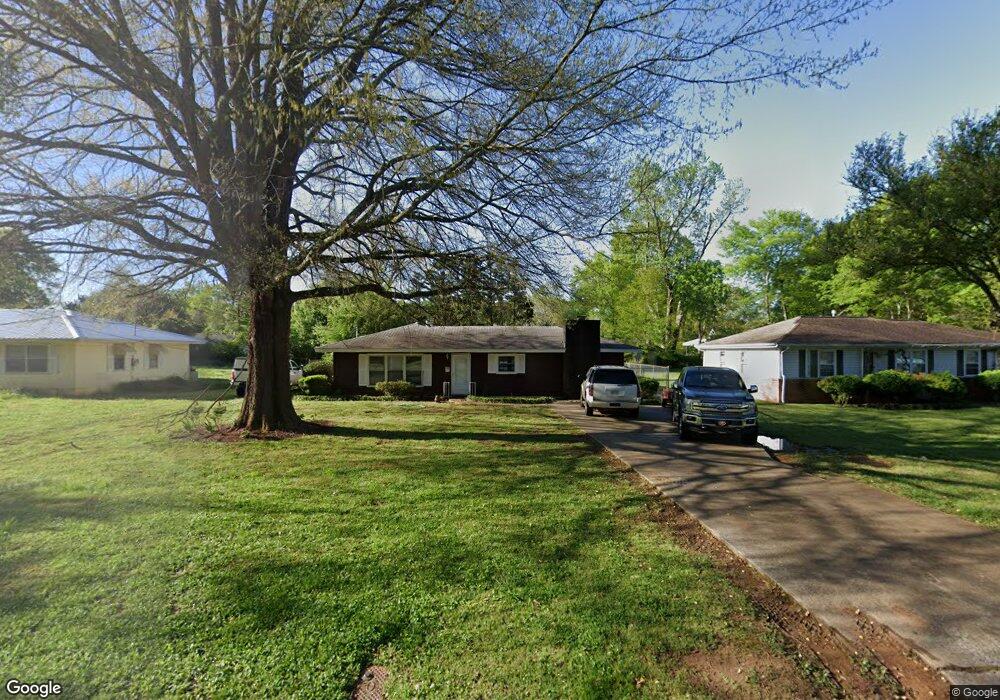
145 Jule Peek Ave Cedartown, GA 30125
Estimated Value: $192,945 - $225,000
3
Beds
2
Baths
1,576
Sq Ft
$134/Sq Ft
Est. Value
About This Home
This home is located at 145 Jule Peek Ave, Cedartown, GA 30125 and is currently estimated at $211,736, approximately $134 per square foot. 145 Jule Peek Ave is a home located in Polk County with nearby schools including Cedar Christian School and Vineyard Harvester Christian Academy.
Ownership History
Date
Name
Owned For
Owner Type
Purchase Details
Closed on
Sep 13, 2017
Sold by
Richardson William G
Bought by
Bennett Eric E
Current Estimated Value
Home Financials for this Owner
Home Financials are based on the most recent Mortgage that was taken out on this home.
Original Mortgage
$96,900
Outstanding Balance
$80,897
Interest Rate
3.89%
Mortgage Type
New Conventional
Estimated Equity
$130,839
Purchase Details
Closed on
Sep 12, 2016
Sold by
William G
Bought by
Richardson William G and Richardson Cathy Ann
Home Financials for this Owner
Home Financials are based on the most recent Mortgage that was taken out on this home.
Original Mortgage
$59,500
Interest Rate
3.45%
Mortgage Type
New Conventional
Purchase Details
Closed on
Dec 8, 1967
Sold by
Culp O L
Bought by
Culp Juanita Hanson
Purchase Details
Closed on
Dec 30, 1955
Bought by
Culp O L
Create a Home Valuation Report for This Property
The Home Valuation Report is an in-depth analysis detailing your home's value as well as a comparison with similar homes in the area
Home Values in the Area
Average Home Value in this Area
Purchase History
| Date | Buyer | Sale Price | Title Company |
|---|---|---|---|
| Bennett Eric E | $102,000 | -- | |
| Richardson William G | -- | -- | |
| Richardson William G | $70,000 | -- | |
| Culp Juanita Hanson | -- | -- | |
| Culp O L | -- | -- |
Source: Public Records
Mortgage History
| Date | Status | Borrower | Loan Amount |
|---|---|---|---|
| Open | Bennett Eric E | $96,900 | |
| Previous Owner | Richardson William G | $59,500 |
Source: Public Records
Tax History Compared to Growth
Tax History
| Year | Tax Paid | Tax Assessment Tax Assessment Total Assessment is a certain percentage of the fair market value that is determined by local assessors to be the total taxable value of land and additions on the property. | Land | Improvement |
|---|---|---|---|---|
| 2024 | $2,174 | $70,141 | $5,600 | $64,541 |
| 2023 | $1,561 | $46,410 | $5,600 | $40,810 |
| 2022 | $914 | $40,496 | $5,600 | $34,896 |
| 2021 | $925 | $40,496 | $5,600 | $34,896 |
| 2020 | $1,125 | $40,496 | $5,600 | $34,896 |
| 2019 | $939 | $36,972 | $4,012 | $32,960 |
| 2018 | $935 | $35,948 | $4,012 | $31,936 |
| 2017 | $762 | $29,433 | $4,012 | $25,421 |
| 2016 | $434 | $29,433 | $4,012 | $25,421 |
| 2015 | $412 | $28,638 | $4,012 | $24,626 |
| 2014 | $415 | $28,638 | $4,012 | $24,626 |
Source: Public Records
Map
Nearby Homes
- 403 Lakeside Dr
- 214 Jule Peek Ave
- 607 N College St
- 408 N College St
- 228 Marshall St
- 443 N Cave Spring St
- 214 Victoria Ave
- 521 W John Hand Rd
- 812 Blanche Rd
- 207 John Phillips Rd
- 112 College Cir
- 254 E Girard Ave
- 305 N Cave Spring St
- 258 Chestnut St
- 422 Walnut St
- 144 Marshall St
- 605 W Girard Ave
- 309 Walnut St
- 328 Mountain Home Rd
- 601 Mountain Home Rd
- 149 Jule Peek Ave
- 141 Jule Peek Ave
- 153 Jule Peek Ave
- 137 Jule Peek Ave
- 137 W Jule Peek Ave
- 150 Thornton Ave
- 146 Thornton Ave
- 154 Thornton Ave
- 150 Jule Peek Ave
- 142 Thornton Ave
- 142 Thornton Ave
- 146 Jule Peek Ave
- 133 Jule Peek Ave
- 158 Thornton Ave
- 154 Jule Peek Ave
- 138 Thornton Ave
- 129 Jule Peek Ave
- 142 Jule Peek Ave
- 134 Thornton Ave
- 151 Thornton Ave