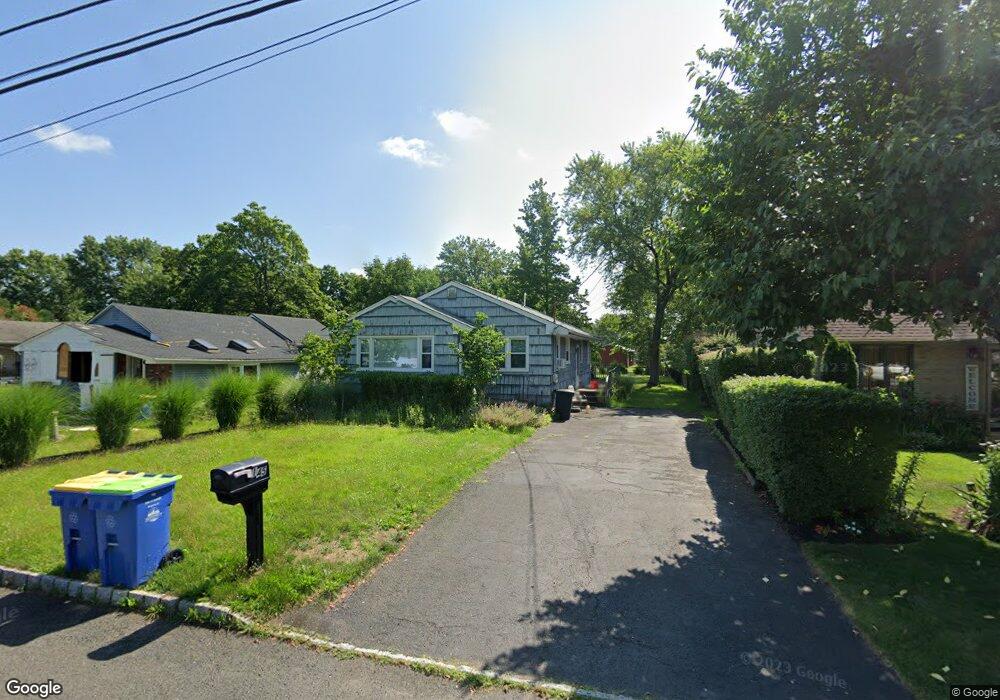
145 Linden St Bridgewater, NJ 08807
Estimated Value: $460,034 - $503,000
--
Bed
--
Bath
1,035
Sq Ft
$470/Sq Ft
Est. Value
About This Home
This home is located at 145 Linden St, Bridgewater, NJ 08807 and is currently estimated at $486,759, approximately $470 per square foot. 145 Linden St is a home located in Somerset County with nearby schools including Bradley Gardens Primary School, Eisenhower Intermediate School, and Bridgewater-Raritan Middle School.
Ownership History
Date
Name
Owned For
Owner Type
Purchase Details
Closed on
Jun 24, 2008
Sold by
Bacher Robert James and Bacher Beth Ann
Bought by
Adler Derek S and Scalisi Marianne
Current Estimated Value
Home Financials for this Owner
Home Financials are based on the most recent Mortgage that was taken out on this home.
Original Mortgage
$274,500
Outstanding Balance
$176,865
Interest Rate
6.13%
Mortgage Type
Purchase Money Mortgage
Estimated Equity
$309,894
Create a Home Valuation Report for This Property
The Home Valuation Report is an in-depth analysis detailing your home's value as well as a comparison with similar homes in the area
Home Values in the Area
Average Home Value in this Area
Purchase History
| Date | Buyer | Sale Price | Title Company |
|---|---|---|---|
| Adler Derek S | $305,000 | Title Agency Inc |
Source: Public Records
Mortgage History
| Date | Status | Borrower | Loan Amount |
|---|---|---|---|
| Open | Adler Derek S | $274,500 |
Source: Public Records
Tax History Compared to Growth
Tax History
| Year | Tax Paid | Tax Assessment Tax Assessment Total Assessment is a certain percentage of the fair market value that is determined by local assessors to be the total taxable value of land and additions on the property. | Land | Improvement |
|---|---|---|---|---|
| 2025 | $7,012 | $356,400 | $163,800 | $192,600 |
| 2024 | $7,012 | $352,000 | $163,800 | $188,200 |
| 2023 | $6,379 | $314,100 | $163,800 | $150,300 |
| 2022 | $5,819 | $275,500 | $158,800 | $116,700 |
| 2021 | $5,761 | $268,800 | $158,800 | $110,000 |
| 2020 | $5,755 | $267,300 | $158,800 | $108,500 |
| 2019 | $5,761 | $265,100 | $158,800 | $106,300 |
| 2018 | $5,695 | $262,800 | $158,800 | $104,000 |
| 2017 | $5,423 | $250,000 | $158,800 | $91,200 |
| 2016 | $5,212 | $244,000 | $158,800 | $85,200 |
| 2015 | $5,173 | $242,400 | $158,800 | $83,600 |
| 2014 | $5,054 | $233,100 | $158,800 | $74,300 |
Source: Public Records
Map
Nearby Homes