Estimated Value: $223,000 - $289,144
2
Beds
2
Baths
744
Sq Ft
$351/Sq Ft
Est. Value
About This Home
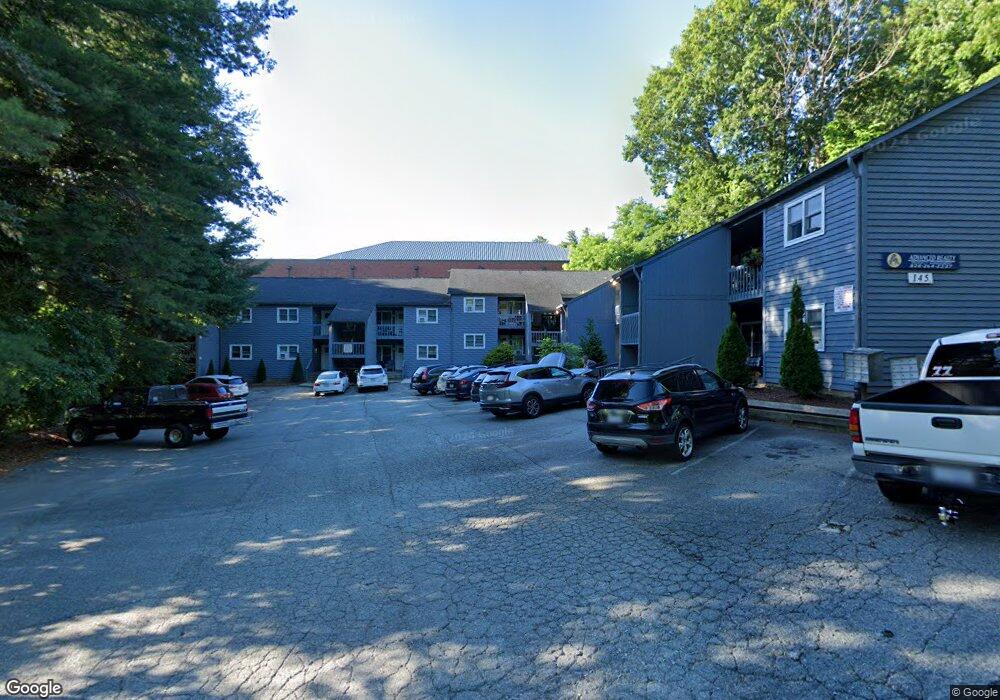
This home is located at 145 Moretz Dr, Boone, NC 28607 and is currently estimated at $261,286, approximately $351 per square foot. 145 Moretz Dr is a home located in Watauga County with nearby schools including Hardin Park Elementary School, Watauga High School, and Mountain Pathways School.
Ownership History
Date
Name
Owned For
Owner Type
Purchase Details
Closed on
Mar 11, 2021
Sold by
Melmak Properties Llc
Bought by
Phillips Group Properties Lp
Current Estimated Value
Home Financials for this Owner
Home Financials are based on the most recent Mortgage that was taken out on this home.
Original Mortgage
$167,462
Outstanding Balance
$144,020
Interest Rate
2.7%
Mortgage Type
Purchase Money Mortgage
Estimated Equity
$117,266
Purchase Details
Closed on
Feb 19, 2019
Sold by
Jones Ada V and Jones Joe Larry
Bought by
Melmak Properties Llc
Home Financials for this Owner
Home Financials are based on the most recent Mortgage that was taken out on this home.
Original Mortgage
$132,000
Interest Rate
4.5%
Mortgage Type
Future Advance Clause Open End Mortgage
Purchase Details
Closed on
Sep 10, 2008
Sold by
Glover Sandra Jean
Bought by
Phillips Et Al Lp
Create a Home Valuation Report for This Property
The Home Valuation Report is an in-depth analysis detailing your home's value as well as a comparison with similar homes in the area
Home Values in the Area
Average Home Value in this Area
Purchase History
| Date | Buyer | Sale Price | Title Company |
|---|---|---|---|
| Phillips Group Properties Lp | $195,000 | None Available | |
| Melmak Properties Llc | $165,000 | None Available | |
| Phillips Et Al Lp | $137,000 | None Available |
Source: Public Records
Mortgage History
| Date | Status | Borrower | Loan Amount |
|---|---|---|---|
| Open | Phillips Group Properties Lp | $167,462 | |
| Previous Owner | Melmak Properties Llc | $132,000 |
Source: Public Records
Tax History
| Year | Tax Paid | Tax Assessment Tax Assessment Total Assessment is a certain percentage of the fair market value that is determined by local assessors to be the total taxable value of land and additions on the property. | Land | Improvement |
|---|---|---|---|---|
| 2025 | $2,200 | $191,000 | $28,000 | $163,000 |
| 2024 | $22 | $191,000 | $28,000 | $163,000 |
| 2023 | $2,063 | $191,000 | $28,000 | $163,000 |
| 2022 | $2,063 | $191,000 | $28,000 | $163,000 |
| 2021 | $1,239 | $137,500 | $35,000 | $102,500 |
| 2020 | $1,198 | $137,500 | $35,000 | $102,500 |
| 2019 | $1,198 | $137,500 | $35,000 | $102,500 |
| 2018 | $1,129 | $137,500 | $35,000 | $102,500 |
| 2017 | $1,129 | $137,500 | $35,000 | $102,500 |
| 2013 | -- | $96,500 | $20,000 | $76,500 |
Source: Public Records
Map
Nearby Homes
- 713 W King St
- 380 W King St
- 890 W King St
- 1358 W King St
- 192 & 206 Orchard St
- 35 acres Poplar Grove Rd
- 229 Old Bristol Rd
- 137 Stoneybrook Ct Unit 102
- 127 Sun Haven Ln
- 357 Kalmia Ln
- 289 Ninebark Rd
- 668 Dogwood Rd
- 229 E King St Unit 9
- 229 E King St Unit 23
- Lot 1 & 2 Coffey Knob Rd
- 1180 Pinnacle Dr
- 134 Mac St Unit 10
- 2137 N Carolina 105
- 448 Howards Knob Rd
- 131 Bryce Way
Your Personal Tour Guide
Ask me questions while you tour the home.