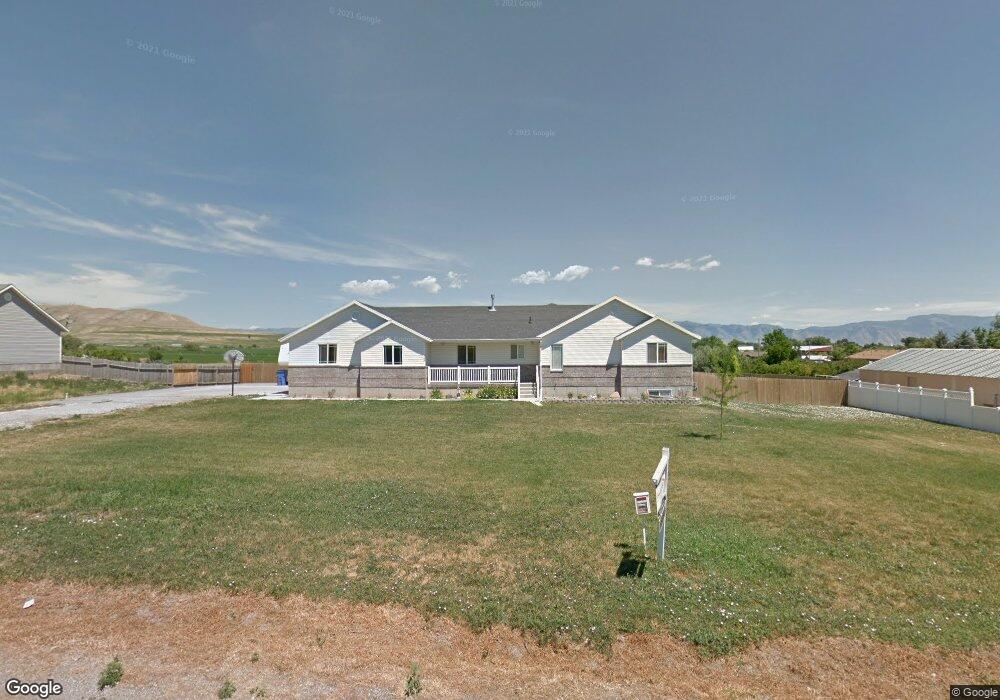
145 N 400 W Unit 2 Newton, UT 84327
Estimated Value: $438,000 - $543,000
--
Bed
--
Bath
1,438
Sq Ft
$331/Sq Ft
Est. Value
About This Home
This home is located at 145 N 400 W Unit 2, Newton, UT 84327 and is currently estimated at $476,618, approximately $331 per square foot. 145 N 400 W Unit 2 is a home located in Cache County with nearby schools including Lewiston School, White Pine Middle School, and North Cache Middle School.
Ownership History
Date
Name
Owned For
Owner Type
Purchase Details
Closed on
Jul 17, 2013
Sold by
Blotter Adam W
Bought by
Jensen Denise and Jensen Dana L
Current Estimated Value
Home Financials for this Owner
Home Financials are based on the most recent Mortgage that was taken out on this home.
Original Mortgage
$45,000
Outstanding Balance
$39,298
Interest Rate
10%
Mortgage Type
Purchase Money Mortgage
Estimated Equity
$437,320
Purchase Details
Closed on
May 3, 2005
Sold by
Sparks Yuvonne N and Yuvonne N Sparks Inter Vivos T
Bought by
Blotter Adam W
Home Financials for this Owner
Home Financials are based on the most recent Mortgage that was taken out on this home.
Original Mortgage
$158,950
Interest Rate
5.99%
Mortgage Type
Construction
Create a Home Valuation Report for This Property
The Home Valuation Report is an in-depth analysis detailing your home's value as well as a comparison with similar homes in the area
Home Values in the Area
Average Home Value in this Area
Purchase History
| Date | Buyer | Sale Price | Title Company |
|---|---|---|---|
| Jensen Denise | -- | American Secure Title Logan | |
| Blotter Adam W | -- | American Secure Title |
Source: Public Records
Mortgage History
| Date | Status | Borrower | Loan Amount |
|---|---|---|---|
| Open | Jensen Denise | $45,000 | |
| Previous Owner | Blotter Adam W | $158,950 |
Source: Public Records
Tax History Compared to Growth
Tax History
| Year | Tax Paid | Tax Assessment Tax Assessment Total Assessment is a certain percentage of the fair market value that is determined by local assessors to be the total taxable value of land and additions on the property. | Land | Improvement |
|---|---|---|---|---|
| 2025 | $2,008 | $292,975 | $0 | $0 |
| 2024 | $1,800 | $240,370 | $0 | $0 |
| 2023 | $1,900 | $239,695 | $0 | $0 |
| 2022 | $1,989 | $239,695 | $0 | $0 |
| 2021 | $1,956 | $360,940 | $61,480 | $299,460 |
| 2020 | $1,750 | $301,830 | $61,480 | $240,350 |
| 2019 | $1,762 | $285,250 | $44,900 | $240,350 |
| 2018 | $1,582 | $253,900 | $44,900 | $209,000 |
| 2017 | $1,533 | $129,195 | $0 | $0 |
| 2016 | $1,554 | $129,195 | $0 | $0 |
| 2015 | $1,394 | $115,765 | $0 | $0 |
| 2014 | $1,336 | $113,545 | $0 | $0 |
| 2013 | -- | $113,545 | $0 | $0 |
Source: Public Records
Map
Nearby Homes
- 180 N 300 W
- 144 N 300 W Unit 13
- 141 N 300 W Unit 12
- 165 N 300 W Unit 11
- 172 N 300 W Unit 14
- 15 S 400 W
- 115 N 100 W Unit 23
- 312 W 200 N Unit 10
- 222 W 200 N Unit 18
- 165 W 200 N
- 136 W 200 N Unit 21
- 244 W 200 N Unit 17
- 260 W 200 N Unit 16
- 158 W 200 N Unit 20
- 116 W 200 N Unit 22
- 362 W 200 N Unit 8
- 340 W 200 N Unit 9
- 9000 N 6400 W
- 145 S 400 W
- 135 W 6600 N Unit 3