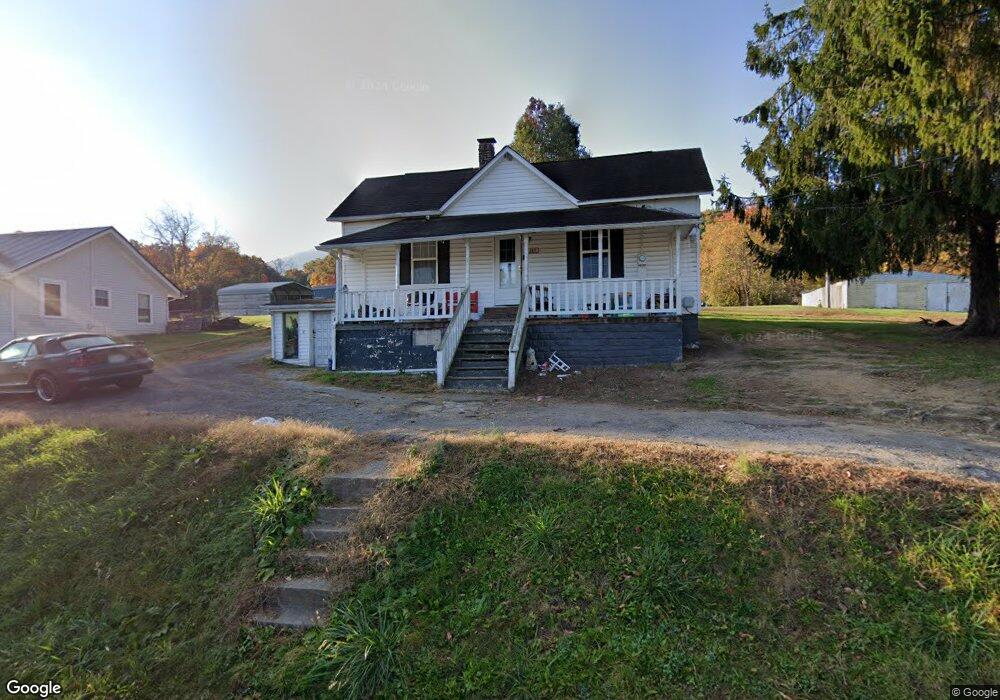
145 Oak Ln Pulaski, VA 24301
Estimated Value: $103,256 - $174,000
2
Beds
1
Bath
1,350
Sq Ft
$108/Sq Ft
Est. Value
About This Home
This home is located at 145 Oak Ln, Pulaski, VA 24301 and is currently estimated at $145,814, approximately $108 per square foot. 145 Oak Ln is a home located in Pulaski County with nearby schools including Critzer Elementary School, Pulaski County High School, and Mayflower Christian Academy.
Ownership History
Date
Name
Owned For
Owner Type
Purchase Details
Closed on
Jun 10, 2024
Sold by
H & L Properties Section C Llc
Bought by
H & L Properties Section B Llc
Current Estimated Value
Purchase Details
Closed on
Jun 4, 2019
Sold by
Lewis Hal D and Lewis Lesia H
Bought by
H & L Properties Section C Llc
Purchase Details
Closed on
Nov 30, 2009
Sold by
Patterson Tr John R and Kimberlin Ellen L
Bought by
Freedom First Federal C U
Purchase Details
Closed on
Mar 17, 2005
Sold by
Howell Charles R and Howell Carolyn L
Bought by
Kimberlin Ellen L
Home Financials for this Owner
Home Financials are based on the most recent Mortgage that was taken out on this home.
Original Mortgage
$28,800
Interest Rate
6.25%
Mortgage Type
New Conventional
Purchase Details
Closed on
Jan 13, 2005
Sold by
Dehart Daniel David
Bought by
Howell Charles R and Howell Carolyn L
Create a Home Valuation Report for This Property
The Home Valuation Report is an in-depth analysis detailing your home's value as well as a comparison with similar homes in the area
Home Values in the Area
Average Home Value in this Area
Purchase History
| Date | Buyer | Sale Price | Title Company |
|---|---|---|---|
| H & L Properties Section B Llc | -- | None Listed On Document | |
| H & L Properties Section C Llc | -- | None Available | |
| Freedom First Federal C U | $43,600 | -- | |
| Kimberlin Ellen L | -- | None Available | |
| Howell Charles R | -- | None Available |
Source: Public Records
Mortgage History
| Date | Status | Borrower | Loan Amount |
|---|---|---|---|
| Previous Owner | Kimberlin Ellen L | $28,800 |
Source: Public Records
Tax History
| Year | Tax Paid | Tax Assessment Tax Assessment Total Assessment is a certain percentage of the fair market value that is determined by local assessors to be the total taxable value of land and additions on the property. | Land | Improvement |
|---|---|---|---|---|
| 2025 | $411 | $55,600 | $8,000 | $47,600 |
| 2024 | $411 | $55,600 | $8,000 | $47,600 |
| 2023 | $411 | $55,600 | $8,000 | $47,600 |
| 2022 | $411 | $55,600 | $8,000 | $47,600 |
| 2021 | $411 | $55,600 | $8,000 | $47,600 |
| 2020 | $374 | $48,600 | $6,000 | $42,600 |
| 2019 | $374 | $48,600 | $6,000 | $42,600 |
| 2018 | $374 | $48,600 | $6,000 | $42,600 |
| 2017 | $311 | $48,600 | $6,000 | $42,600 |
| 2016 | $311 | $48,600 | $6,000 | $42,600 |
| 2015 | $311 | $48,600 | $6,000 | $42,600 |
| 2014 | $257 | $43,600 | $8,000 | $35,600 |
| 2013 | $257 | $43,600 | $8,000 | $35,600 |
Source: Public Records
Map
Nearby Homes
- TBD Herron St
- 876 Dillon St
- 1224 Macgill St
- 520 Jackson Ave
- 516 Jackson Ave
- 639 5th St NE
- 502 Dora Hwy
- 718 Walnut Ave
- 138 Pierce Ave
- 410 Draper Ave
- 1217 Newbern Rd
- 745 Peppers Ferry Rd
- 715 Franklin Ave
- 1713 Monte Vista Dr
- 128 Lexington Ave
- 1125 Peppers Ferry Rd
- 1600 Claremont Ct
- 411 S Washington Ave
- 221 S Washington Ave
- 215 S Washington Ave
Your Personal Tour Guide
Ask me questions while you tour the home.