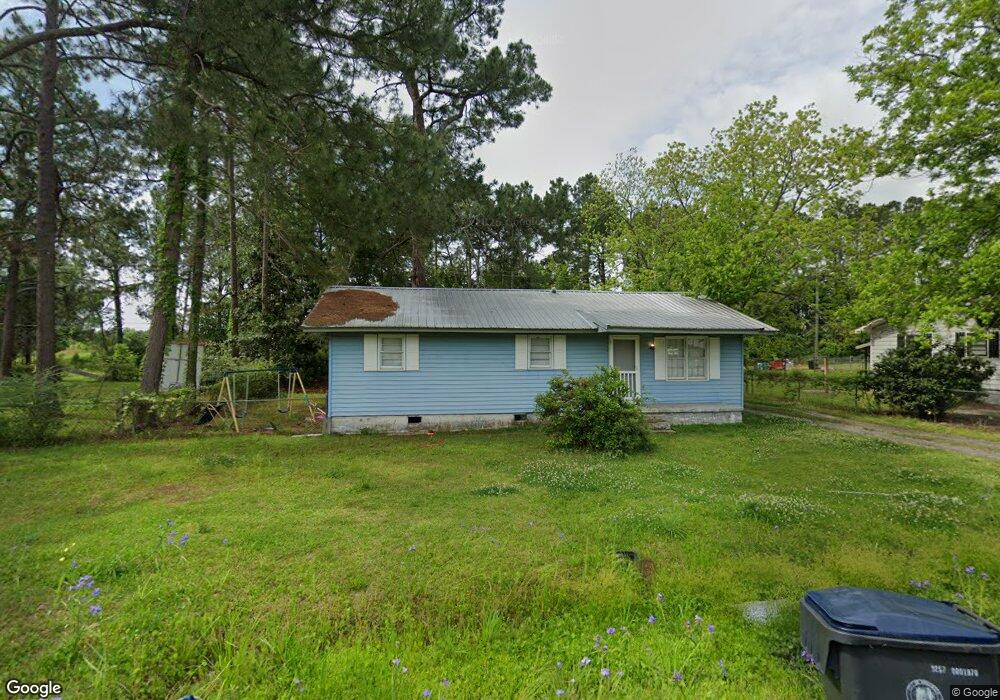
145 Pierce Cir Fitzgerald, GA 31750
Estimated Value: $64,000 - $156,000
3
Beds
1
Bath
1,056
Sq Ft
$88/Sq Ft
Est. Value
About This Home
This home is located at 145 Pierce Cir, Fitzgerald, GA 31750 and is currently estimated at $92,809, approximately $87 per square foot. 145 Pierce Cir is a home located in Ben Hill County with nearby schools including Ben Hill County Primary School, Ben Hill Elementary School, and Ben Hill County Middle School.
Ownership History
Date
Name
Owned For
Owner Type
Purchase Details
Closed on
Jun 4, 2019
Sold by
White Jamila S
Bought by
Culpepper Bobby L
Current Estimated Value
Purchase Details
Closed on
Mar 17, 2017
Sold by
Culpepper Bobby L
Bought by
Martinez White Jamila S and Martinez Alivores Ivan
Home Financials for this Owner
Home Financials are based on the most recent Mortgage that was taken out on this home.
Original Mortgage
$41,500
Interest Rate
4.15%
Mortgage Type
New Conventional
Purchase Details
Closed on
Apr 27, 2012
Sold by
Sawyer Patricia
Bought by
Culpepper Bobby L
Purchase Details
Closed on
Mar 26, 1998
Sold by
Anderson Alton
Bought by
Sawyer Patricia
Purchase Details
Closed on
Apr 6, 1987
Sold by
Smith Robert and Smith L
Bought by
Delta Discount Corp
Purchase Details
Closed on
Mar 1, 1979
Bought by
Smith Robert and Smith L
Create a Home Valuation Report for This Property
The Home Valuation Report is an in-depth analysis detailing your home's value as well as a comparison with similar homes in the area
Home Values in the Area
Average Home Value in this Area
Purchase History
| Date | Buyer | Sale Price | Title Company |
|---|---|---|---|
| Culpepper Bobby L | -- | -- | |
| Martinez White Jamila S | $45,000 | -- | |
| Culpepper Bobby L | $15,000 | -- | |
| Sawyer Patricia | $29,500 | -- | |
| Anderson Alton | -- | -- | |
| Delta Discount Corp | $1,000 | -- | |
| Smith Robert | -- | -- |
Source: Public Records
Mortgage History
| Date | Status | Borrower | Loan Amount |
|---|---|---|---|
| Previous Owner | Martinez White Jamila S | $41,500 |
Source: Public Records
Tax History Compared to Growth
Tax History
| Year | Tax Paid | Tax Assessment Tax Assessment Total Assessment is a certain percentage of the fair market value that is determined by local assessors to be the total taxable value of land and additions on the property. | Land | Improvement |
|---|---|---|---|---|
| 2024 | $940 | $22,034 | $1,600 | $20,434 |
| 2023 | $655 | $21,346 | $1,600 | $19,746 |
| 2022 | $608 | $18,387 | $1,600 | $16,787 |
| 2021 | $577 | $16,804 | $1,600 | $15,204 |
| 2020 | $579 | $16,667 | $1,600 | $15,067 |
| 2019 | $577 | $16,667 | $1,600 | $15,067 |
| 2018 | $675 | $15,670 | $1,600 | $14,070 |
| 2017 | $365 | $10,481 | $1,600 | $8,881 |
| 2016 | $325 | $9,776 | $1,600 | $8,176 |
| 2015 | -- | $9,862 | $1,600 | $8,262 |
| 2014 | -- | $10,835 | $2,400 | $8,435 |
Source: Public Records
Map
Nearby Homes
- 701 S Monitor Dr
- 512 E Lemon St
- 217 Ocilla Hwy
- 709 E Orange St
- 407 E Lemon St
- 130 Arnold Dr
- TRACT 7 Benjamin H Hill Dr
- 411 S Meade St
- 815 E Jessamine St
- 117 Royal Cir
- 515 S Grant St
- 510 S Grant St
- 155 Grove Ave
- 0 E Magnolia St
- 510 S Main St
- 114 Taylor Cir
- 211 W Roanoke Dr
- TBD Amber St
- 440 Ocilla Hwy
- 412 S Main St