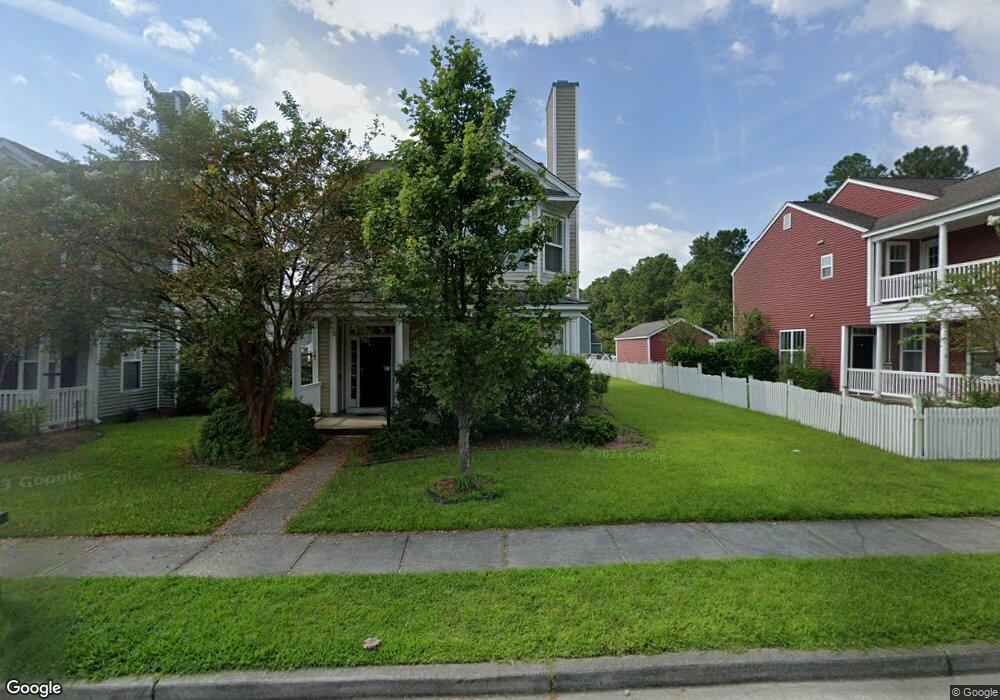
145 Red Leaf Blvd Moncks Corner, SC 29461
Estimated Value: $326,000 - $359,000
3
Beds
3
Baths
1,855
Sq Ft
$182/Sq Ft
Est. Value
About This Home
This home is located at 145 Red Leaf Blvd, Moncks Corner, SC 29461 and is currently estimated at $337,217, approximately $181 per square foot. 145 Red Leaf Blvd is a home located in Berkeley County with nearby schools including Foxbank Elementary School, Berkeley Middle School, and Berkeley High School.
Ownership History
Date
Name
Owned For
Owner Type
Purchase Details
Closed on
Oct 23, 2012
Sold by
Reo Solutions Llc
Bought by
Jordan Juanita M
Current Estimated Value
Home Financials for this Owner
Home Financials are based on the most recent Mortgage that was taken out on this home.
Original Mortgage
$146,055
Outstanding Balance
$99,891
Interest Rate
3.25%
Mortgage Type
FHA
Estimated Equity
$237,326
Purchase Details
Closed on
May 9, 2012
Sold by
Hyman Randall and Ryan Carie Ann
Bought by
Reo Solutions Llc
Purchase Details
Closed on
Mar 30, 2007
Sold by
D R Horton Inc
Bought by
Hyman Randal and Ryan Carie Ann
Home Financials for this Owner
Home Financials are based on the most recent Mortgage that was taken out on this home.
Original Mortgage
$37,200
Interest Rate
6.01%
Mortgage Type
Stand Alone Second
Purchase Details
Closed on
Jan 10, 2006
Sold by
Foxbank Ventures Llc
Bought by
D R Horton Inc
Create a Home Valuation Report for This Property
The Home Valuation Report is an in-depth analysis detailing your home's value as well as a comparison with similar homes in the area
Purchase History
| Date | Buyer | Sale Price | Title Company |
|---|---|---|---|
| Jordan Juanita M | $148,750 | -- | |
| Reo Solutions Llc | $100,514 | -- | |
| Hyman Randal | $189,000 | None Available | |
| D R Horton Inc | $280,100 | None Available |
Source: Public Records
Mortgage History
| Date | Status | Borrower | Loan Amount |
|---|---|---|---|
| Open | Jordan Juanita M | $146,055 | |
| Previous Owner | Hyman Randal | $37,200 |
Source: Public Records
Tax History
| Year | Tax Paid | Tax Assessment Tax Assessment Total Assessment is a certain percentage of the fair market value that is determined by local assessors to be the total taxable value of land and additions on the property. | Land | Improvement |
|---|---|---|---|---|
| 2025 | $1,381 | $181,470 | $49,782 | $131,688 |
| 2024 | $1,289 | $7,259 | $1,991 | $5,268 |
| 2023 | $1,289 | $7,259 | $1,991 | $5,268 |
| 2022 | $1,239 | $6,312 | $1,920 | $4,392 |
| 2021 | $1,189 | $6,310 | $1,920 | $4,392 |
| 2020 | $1,240 | $6,312 | $1,920 | $4,392 |
| 2019 | $1,226 | $6,312 | $1,920 | $4,392 |
| 2018 | $1,114 | $5,752 | $1,440 | $4,312 |
| 2017 | $1,118 | $5,752 | $1,440 | $4,312 |
| 2016 | $981 | $5,750 | $1,440 | $4,310 |
| 2015 | $849 | $5,750 | $1,440 | $4,310 |
| 2014 | $837 | $5,750 | $1,440 | $4,310 |
| 2013 | -- | $5,750 | $1,440 | $4,310 |
Source: Public Records
Map
Nearby Homes
- 143 Red Leaf Blvd
- 136 Red Leaf Blvd
- 120 Worthington Dr
- 112 Worthington Dr
- 102 Worthington Dr
- 113 Red Leaf Blvd
- 151 Kimberton Ave
- 220 Devonshire Dr
- 169 Woodbrook Way
- 208 Woodbrook Way
- 244 Devonshire Dr
- 581 Trotters Ln
- 261 Woodbrook Way
- 263 Woodbrook Way
- 256 Woodbrook Way
- 524 Trotters Ln
- 499 Trotters Ln
- 500 Trotters Ln
- 435 Foxbank Plantation Blvd
- 770 Trotters Ln
- 147 Red Leaf Blvd
- 141 Red Leaf Blvd
- 204 Killarney Trail
- 206 Killarney Trail
- 139 Red Leaf Blvd
- 208 Killarney Trail
- 137 Red Leaf Blvd
- 210 Killarney Trail
- 138 Red Leaf Blvd
- 212 Killarney Trail
- 135 Red Leaf Blvd
- 140 Red Leaf Blvd
- 134 Red Leaf Blvd
- 142 Red Leaf Blvd
- 401 Farrow Ct
- 214 Killarney Trail
- 133 Red Leaf Blvd
- 144 Red Leaf Blvd
- 132 Red Leaf Blvd
- 403 Farrow Ct
Your Personal Tour Guide
Ask me questions while you tour the home.