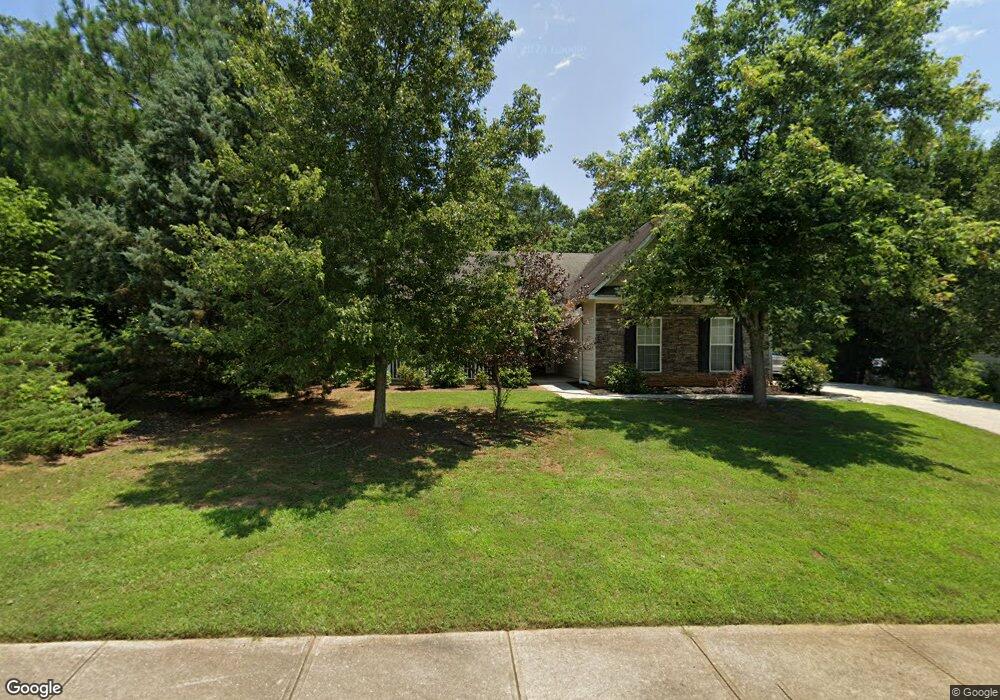
145 Red Tail Rd Jefferson, GA 30549
Estimated Value: $361,000 - $390,000
3
Beds
2
Baths
2,326
Sq Ft
$160/Sq Ft
Est. Value
About This Home
This home is located at 145 Red Tail Rd, Jefferson, GA 30549 and is currently estimated at $372,470, approximately $160 per square foot. 145 Red Tail Rd is a home located in Jackson County with nearby schools including Jefferson Elementary School, Jefferson Academy, and Jefferson Middle School.
Ownership History
Date
Name
Owned For
Owner Type
Purchase Details
Closed on
Nov 6, 2015
Sold by
Heenan Gregory B
Bought by
Jines Matthew David
Current Estimated Value
Home Financials for this Owner
Home Financials are based on the most recent Mortgage that was taken out on this home.
Original Mortgage
$161,336
Outstanding Balance
$125,093
Interest Rate
3.78%
Mortgage Type
New Conventional
Estimated Equity
$247,377
Purchase Details
Closed on
Sep 29, 2006
Sold by
Not Provided
Bought by
Heenan Gregory B
Home Financials for this Owner
Home Financials are based on the most recent Mortgage that was taken out on this home.
Original Mortgage
$70,000
Interest Rate
6.36%
Mortgage Type
New Conventional
Purchase Details
Closed on
Feb 27, 2003
Sold by
Harbins Development
Bought by
Berkeley Homes Inc
Create a Home Valuation Report for This Property
The Home Valuation Report is an in-depth analysis detailing your home's value as well as a comparison with similar homes in the area
Home Values in the Area
Average Home Value in this Area
Purchase History
| Date | Buyer | Sale Price | Title Company |
|---|---|---|---|
| Jines Matthew David | $156,900 | -- | |
| Heenan Gregory B | $164,900 | -- | |
| Berkeley Homes Inc | $35,000 | -- |
Source: Public Records
Mortgage History
| Date | Status | Borrower | Loan Amount |
|---|---|---|---|
| Open | Jines Matthew David | $161,336 | |
| Previous Owner | Heenan Gregory B | $70,000 |
Source: Public Records
Tax History
| Year | Tax Paid | Tax Assessment Tax Assessment Total Assessment is a certain percentage of the fair market value that is determined by local assessors to be the total taxable value of land and additions on the property. | Land | Improvement |
|---|---|---|---|---|
| 2025 | $3,099 | $112,920 | $28,400 | $84,520 |
| 2024 | $3,099 | $108,520 | $24,000 | $84,520 |
| 2023 | $2,991 | $99,640 | $24,000 | $75,640 |
| 2022 | $2,750 | $85,560 | $24,000 | $61,560 |
| 2021 | $2,539 | $77,560 | $16,000 | $61,560 |
| 2020 | $2,351 | $67,120 | $16,000 | $51,120 |
| 2019 | $2,273 | $63,920 | $12,800 | $51,120 |
| 2018 | $2,202 | $61,440 | $12,800 | $48,640 |
| 2017 | $2,210 | $60,440 | $12,800 | $47,640 |
| 2016 | $2,221 | $60,440 | $12,800 | $47,640 |
| 2015 | $1,893 | $51,310 | $8,000 | $43,310 |
| 2014 | $1,786 | $47,935 | $8,000 | $39,935 |
| 2013 | -- | $46,674 | $8,000 | $38,674 |
Source: Public Records
Map
Nearby Homes
- 33 Hometown Ct
- 37 Hometown Ct
- 924 Brockton Rd
- 0 Brockton Loop Unit 2 & 3
- 0 Brockton Loop Unit 7711370
- 0 Brockton Loop Unit 10681293
- 386 Red Dragon Dr
- 166 Montview Dr
- 166 Montview Dr Unit 112
- 372 Glenside Dr
- 372 Glenside Dr Unit 76
- 51 Merwood Ln
- 184 Montview Dr
- 63 Merwood Ln
- 939 Canter Way
- 75 Merwood Ln
- 85 Merwood Ln
- 191 Merwood Ln
- 179 Merwood Ln Unit 125
- 179 Merwood Ln
- 145 Redtail Rd
- 131 Redtail Rd
- 169 Redtail Rd
- 146 Redtail Rd
- 109 Redtail Rd
- 109 Red Tail Rd
- 152 Isaiah Dr
- 124 Redtail Rd
- 191 Redtail Rd
- 190 Isaiah Dr
- 170 Redtail Rd
- 102 Redtail Rd
- 102 Redtail Rd Unit 5A
- 85 Redtail Rd
- 122 Isaiah Dr
- 122 Isaiah Dr Unit 1
- 122 Isaiah Dr Unit 3
- 196 Redtail Rd
- 211 Redtail Rd Unit 67
- 211 Redtail Rd
Your Personal Tour Guide
Ask me questions while you tour the home.