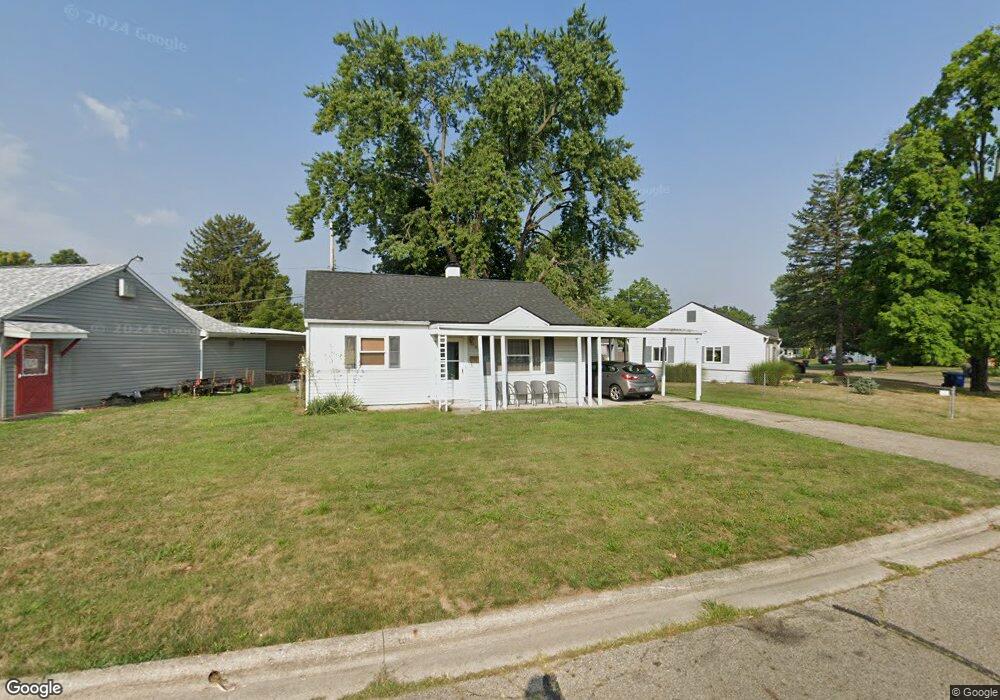
145 Ross Rd Columbus, OH 43213
Estimated Value: $144,000 - $169,000
2
Beds
1
Bath
750
Sq Ft
$211/Sq Ft
Est. Value
About This Home
This home is located at 145 Ross Rd, Columbus, OH 43213 and is currently estimated at $157,990, approximately $210 per square foot. 145 Ross Rd is a home located in Franklin County with nearby schools including Etna Road Elementary School, Beechwood Elementary School, and Rosemore Middle School.
Ownership History
Date
Name
Owned For
Owner Type
Purchase Details
Closed on
Dec 24, 2003
Sold by
Russo Nancy A and Russo Arthur F
Bought by
Bornheim Charles J
Current Estimated Value
Home Financials for this Owner
Home Financials are based on the most recent Mortgage that was taken out on this home.
Original Mortgage
$64,800
Interest Rate
5.84%
Mortgage Type
Purchase Money Mortgage
Purchase Details
Closed on
Aug 18, 1998
Sold by
Oser Joseph M and Oser Cynthia
Bought by
Russo Nancy A and Russo Julie
Home Financials for this Owner
Home Financials are based on the most recent Mortgage that was taken out on this home.
Original Mortgage
$52,900
Interest Rate
6.99%
Purchase Details
Closed on
Aug 18, 1997
Sold by
Petty Carla L and Petty Carla L
Bought by
Oser Joseph M
Purchase Details
Closed on
Apr 1, 1987
Create a Home Valuation Report for This Property
The Home Valuation Report is an in-depth analysis detailing your home's value as well as a comparison with similar homes in the area
Home Values in the Area
Average Home Value in this Area
Purchase History
| Date | Buyer | Sale Price | Title Company |
|---|---|---|---|
| Bornheim Charles J | $72,000 | Foundation Title Agency Inc | |
| Russo Nancy A | $54,900 | Foundation Title Agency Inc | |
| Oser Joseph M | $56,000 | Chicago Title | |
| -- | $34,900 | -- |
Source: Public Records
Mortgage History
| Date | Status | Borrower | Loan Amount |
|---|---|---|---|
| Closed | Bornheim Charles J | $64,800 | |
| Previous Owner | Russo Nancy A | $52,900 |
Source: Public Records
Tax History Compared to Growth
Tax History
| Year | Tax Paid | Tax Assessment Tax Assessment Total Assessment is a certain percentage of the fair market value that is determined by local assessors to be the total taxable value of land and additions on the property. | Land | Improvement |
|---|---|---|---|---|
| 2024 | $1,915 | $42,770 | $13,370 | $29,400 |
| 2023 | $1,901 | $42,770 | $13,370 | $29,400 |
| 2022 | $1,455 | $24,860 | $6,550 | $18,310 |
| 2021 | $1,368 | $24,860 | $6,550 | $18,310 |
| 2020 | $1,355 | $24,860 | $6,550 | $18,310 |
| 2019 | $1,253 | $19,990 | $5,250 | $14,740 |
| 2018 | $1,219 | $19,990 | $5,250 | $14,740 |
| 2017 | $1,213 | $19,990 | $5,250 | $14,740 |
| 2016 | $1,150 | $17,120 | $4,800 | $12,320 |
| 2015 | $1,160 | $17,120 | $4,800 | $12,320 |
| 2014 | $1,160 | $17,120 | $4,800 | $12,320 |
| 2013 | $613 | $19,005 | $5,320 | $13,685 |
Source: Public Records
Map
Nearby Homes
- 4489 Saint Margaret Ln
- 353 Shell Ct E
- 4368 Broadhurst Dr
- 451 Beaver Ave
- 571 S Hamilton Rd
- 424 Cumberland Dr
- 469 Cumberland Dr
- 322 Fairway Cir
- 4232 Mayflower Blvd
- 4780 Etna Rd Unit 782
- 4653 Kae Ave
- 579 Westphal Ave
- 4148 Elbern Ave
- 547 Country Club Rd
- 4662 Jae Ave
- 110 Ironclad Dr Unit 9
- 185 Prairiecreek Way Unit 185
- 91 Robinwood Ave
- 686 Fairway Blvd
- 798 S Yearling Rd
- 155 Ross Rd
- 4619 Norton Ln
- 4610 Saint Anthony Ln
- 4611 Norton Ln
- 4604 Saint Anthony Ln
- 152 Ross Rd
- 158 Ross Rd
- 146 Ross Rd
- 4605 Norton Ln
- 140 Ross Rd
- 4598 Saint Anthony Ln
- 166 Ross Rd
- 4634 Norton Ln
- 4628 Norton Ln
- 4622 Norton Ln
- 181 Ross Rd
- 4599 Norton Ln
- 4590 Saint Anthony Ln
- 4614 Norton Ln
- 4607 Saint Anthony Ln