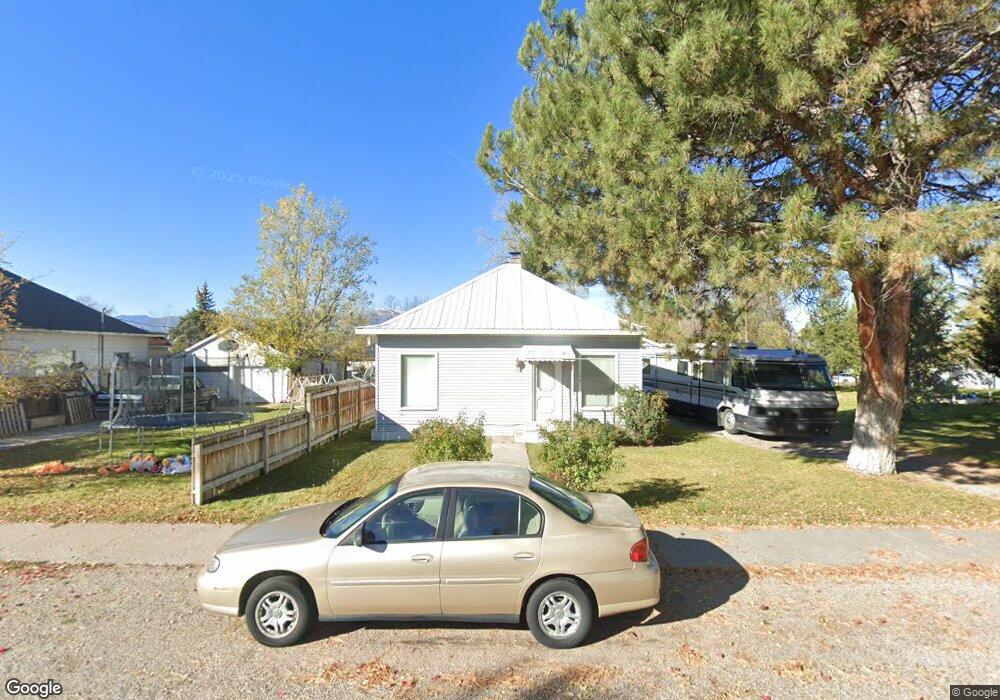
145 S 3rd St E Downey, ID 83234
Estimated Value: $203,614 - $261,000
2
Beds
1
Bath
1,049
Sq Ft
$220/Sq Ft
Est. Value
About This Home
This home is located at 145 S 3rd St E, Downey, ID 83234 and is currently estimated at $231,205, approximately $220 per square foot. 145 S 3rd St E is a home located in Bannock County with nearby schools including Downey Elementary School, Marsh Valley Middle School, and Marsh Valley High School.
Ownership History
Date
Name
Owned For
Owner Type
Purchase Details
Closed on
Sep 25, 2009
Sold by
Higley Kevin and Higley Denise
Bought by
Guccini William T
Current Estimated Value
Home Financials for this Owner
Home Financials are based on the most recent Mortgage that was taken out on this home.
Original Mortgage
$31,000
Outstanding Balance
$20,253
Interest Rate
5.25%
Mortgage Type
New Conventional
Estimated Equity
$210,952
Purchase Details
Closed on
Sep 19, 2006
Sold by
Nielsen Brenda
Bought by
Nielsen Ronald Troy
Create a Home Valuation Report for This Property
The Home Valuation Report is an in-depth analysis detailing your home's value as well as a comparison with similar homes in the area
Purchase History
| Date | Buyer | Sale Price | Title Company |
|---|---|---|---|
| Guccini William T | -- | Amerititle | |
| Nielsen Ronald Troy | -- | -- |
Source: Public Records
Mortgage History
| Date | Status | Borrower | Loan Amount |
|---|---|---|---|
| Open | Guccini William T | $31,000 |
Source: Public Records
Tax History
| Year | Tax Paid | Tax Assessment Tax Assessment Total Assessment is a certain percentage of the fair market value that is determined by local assessors to be the total taxable value of land and additions on the property. | Land | Improvement |
|---|---|---|---|---|
| 2025 | $1,346 | $163,901 | $35,625 | $128,276 |
| 2024 | $1,466 | $143,224 | $35,625 | $107,599 |
| 2023 | $1,554 | $157,122 | $33,476 | $123,646 |
| 2022 | $1,554 | $87,276 | $22,188 | $65,088 |
| 2021 | $1,150 | $87,276 | $22,188 | $65,088 |
| 2020 | $1,132 | $77,148 | $17,750 | $59,398 |
| 2019 | $915 | $60,983 | $9,250 | $51,733 |
| 2018 | $911 | $50,456 | $9,250 | $41,206 |
| 2017 | $904 | $49,228 | $9,250 | $39,978 |
| 2016 | $920 | $49,228 | $9,250 | $39,978 |
| 2015 | $927 | $0 | $0 | $0 |
| 2012 | -- | $49,228 | $9,250 | $39,978 |
Source: Public Records
Map
Nearby Homes
- 65 S 3rd St E
- 280 E 2nd S
- 178 E Center St
- TBD Lot 6 Second St E
- TBD Lot 7 Second St E
- TBD Lot 8 Second St E
- TBD Lot 6,7,8 Second St E
- 79 E 2nd St
- TBD Brush Creek
- TBD N 1st W
- 326 S 3rd St E
- 1 N Cambridge Rd
- Lot 2 N Cambridge Rd
- TBD N Main St
- TBD N 4th E
- 679 E 2nd St N
- 284 N Main St
- 20729 U S 91
- TBD W 3rd St N
- TBD N 4th N
Your Personal Tour Guide
Ask me questions while you tour the home.