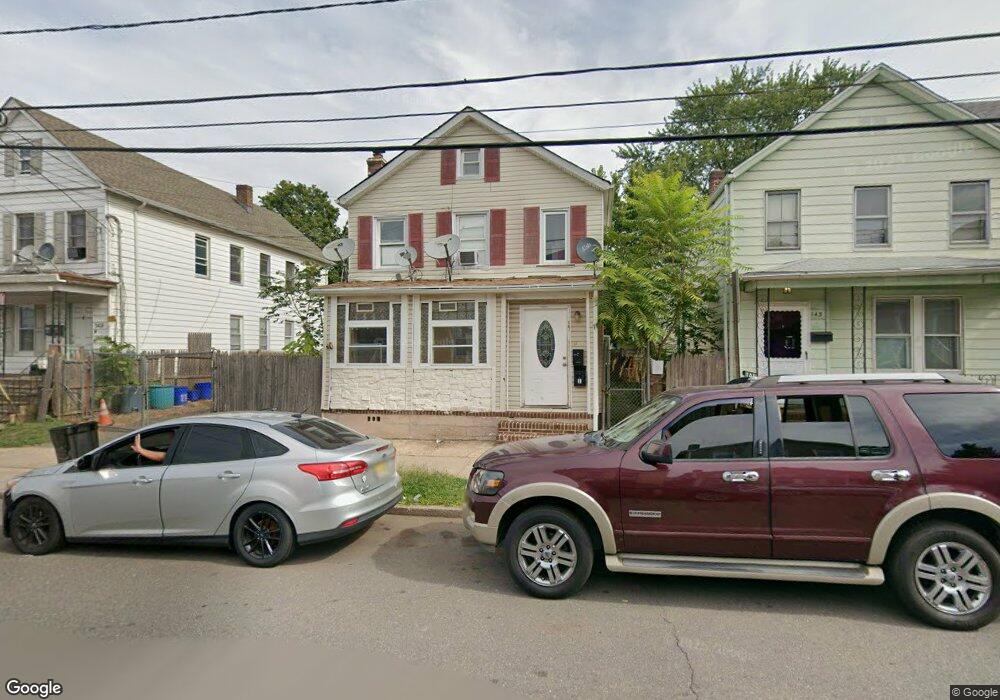
145 Seaman St Unit 2 New Brunswick, NJ 08901
Estimated Value: $431,000 - $484,117
2
Beds
1
Bath
1,672
Sq Ft
$274/Sq Ft
Est. Value
About This Home
This home is located at 145 Seaman St Unit 2, New Brunswick, NJ 08901 and is currently estimated at $457,779, approximately $273 per square foot. 145 Seaman St Unit 2 is a home located in Middlesex County with nearby schools including New Brunswick High School, Central Jersey College Prep Charter School, and St. Mary of Mount Virgin School.
Ownership History
Date
Name
Owned For
Owner Type
Purchase Details
Closed on
Mar 9, 2012
Sold by
Luthra Dilip
Bought by
Luthra Rachana
Current Estimated Value
Purchase Details
Closed on
Nov 14, 2005
Sold by
Williams Nathaniel
Bought by
Fan Angela and Deleon Jovita
Purchase Details
Closed on
May 30, 2002
Sold by
Belton Leroy
Bought by
Williams Nathaniel
Home Financials for this Owner
Home Financials are based on the most recent Mortgage that was taken out on this home.
Original Mortgage
$59,400
Interest Rate
6.8%
Create a Home Valuation Report for This Property
The Home Valuation Report is an in-depth analysis detailing your home's value as well as a comparison with similar homes in the area
Home Values in the Area
Average Home Value in this Area
Purchase History
| Date | Buyer | Sale Price | Title Company |
|---|---|---|---|
| Luthra Rachana | -- | None Available | |
| Fan Angela | $107,000 | -- | |
| Williams Nathaniel | $66,000 | -- |
Source: Public Records
Mortgage History
| Date | Status | Borrower | Loan Amount |
|---|---|---|---|
| Previous Owner | Williams Nathaniel | $59,400 |
Source: Public Records
Tax History Compared to Growth
Tax History
| Year | Tax Paid | Tax Assessment Tax Assessment Total Assessment is a certain percentage of the fair market value that is determined by local assessors to be the total taxable value of land and additions on the property. | Land | Improvement |
|---|---|---|---|---|
| 2025 | $5,903 | $225,400 | $112,500 | $112,900 |
| 2024 | $5,732 | $225,400 | $112,500 | $112,900 |
| 2023 | $5,732 | $225,400 | $112,500 | $112,900 |
| 2022 | $5,610 | $225,400 | $112,500 | $112,900 |
| 2021 | $4,162 | $225,400 | $112,500 | $112,900 |
| 2020 | $5,567 | $225,400 | $112,500 | $112,900 |
| 2019 | $5,461 | $225,400 | $112,500 | $112,900 |
| 2018 | $5,337 | $225,400 | $112,500 | $112,900 |
| 2017 | $5,126 | $225,400 | $112,500 | $112,900 |
| 2016 | $6,089 | $103,800 | $33,800 | $70,000 |
| 2015 | $5,944 | $103,800 | $33,800 | $70,000 |
| 2014 | $5,838 | $103,800 | $33,800 | $70,000 |
Source: Public Records
Map
Nearby Homes
- 186 Townsend St
- 168 Redmond St
- 122A Remsen Ave Unit A
- 122B Remsen Ave Unit A
- 34 Lee Ave
- 128 Remsen Ave Unit A
- 128A Remsen Ave
- 68 Welton St
- 74 Welton St
- 214 Redmond St
- 216 Handy St
- 73 Carman St
- 87 Paul Robeson Blvd
- 81 Redmond St
- 163 Livingston Ave
- 144 George St
- 264 Seaman St
- 267 Handy St
- 72 Comstock St
- 49 Comstock St