


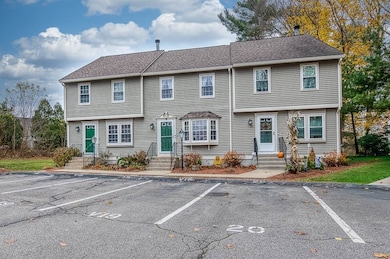
145 South St Unit 19 Walpole, MA 02081
Estimated payment $2,808/month
Highlights
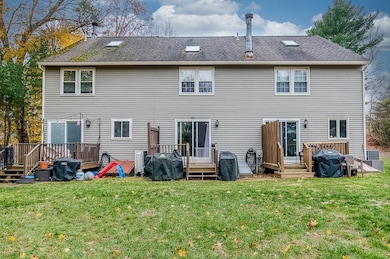
- Deck
- Property is near public transit
- Carpet
- Elm Street School Rated A-
- Central Air
- Heat Pump System
About This Home
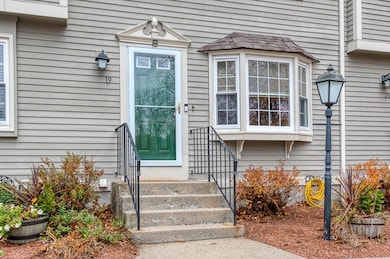
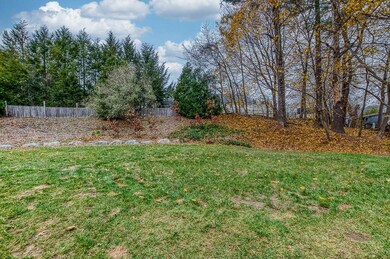
Wonderfully maintained 2 bedroom, 1.5 bath townhouse condominium unit located at sought after South Village Condominium. This adorable home features a spacious fireplaced living room with slider to deck which overlooks a big, level yard. The first floor also features a fully applianced oak kitchen with recessed lighting and ceramic tile flooring as well as a nice half bath. There's 2 spacious bedrooms with great closet space, and a full bath with direct access from the primary bedroom, as well as the common hallway. Big, unfinished basement with laundry hookups and lots of storage. Other features include updated 2 zone heat and ac and 2 assigned parking spaces along with some guest parking. Just a short distance to downtown shops, restaurants, commuter rail station, bus line and Walpole High School. Enjoy additional shopping and dining only a few minutes away at Patriot Place.
Townhouse Details
Home Type
- Townhome
Est. Annual Taxes
- $5,304
Year Built
- Built in 1990
Home Design
- Entry on the 1st floor
- Shingle Roof
Interior Spaces
- 1,188 Sq Ft Home
- 2-Story Property
- Living Room with Fireplace
- Carpet
- Basement
- Laundry in Basement
Kitchen
- Range
- Microwave
- Dishwasher
- Disposal
Bedrooms and Bathrooms
- 2 Bedrooms
- Primary bedroom located on second floor
Parking
- 2 Car Parking Spaces
- Off-Street Parking
- Assigned Parking
Schools
- Boyden Elementary School
- Bird Middle School
- Walpole High School
Utilities
- Central Air
- 2 Cooling Zones
- 2 Heating Zones
- Heat Pump System
Additional Features
- Deck
- Two or More Common Walls
- Property is near public transit
Listing and Financial Details
- Assessor Parcel Number M:00033 B:00160 L:00019,249337
Community Details
Overview
- Association fees include insurance, maintenance structure, ground maintenance, snow removal
- 20 Units
- South Village Townhouses Community
Pet Policy
- Call for details about the types of pets allowed
Map
Home Values in the Area
Average Home Value in this Area
Tax History
| Year | Tax Paid | Tax Assessment Tax Assessment Total Assessment is a certain percentage of the fair market value that is determined by local assessors to be the total taxable value of land and additions on the property. | Land | Improvement |
|---|---|---|---|---|
| 2025 | $5,304 | $413,400 | $0 | $413,400 |
| 2024 | $4,730 | $357,800 | $0 | $357,800 |
| 2023 | $4,560 | $328,300 | $0 | $328,300 |
| 2022 | $4,231 | $292,600 | $0 | $292,600 |
| 2021 | $4,216 | $284,100 | $0 | $284,100 |
| 2020 | $3,935 | $262,500 | $0 | $262,500 |
| 2019 | $3,849 | $254,900 | $0 | $254,900 |
| 2018 | $3,672 | $240,500 | $0 | $240,500 |
| 2017 | $3,578 | $233,400 | $0 | $233,400 |
| 2016 | $3,633 | $233,500 | $0 | $233,500 |
| 2015 | $3,324 | $211,700 | $0 | $211,700 |
| 2014 | $3,373 | $214,000 | $0 | $214,000 |
Property History
| Date | Event | Price | List to Sale | Price per Sq Ft |
|---|---|---|---|---|
| 11/25/2025 11/25/25 | Pending | -- | -- | -- |
| 11/13/2025 11/13/25 | For Sale | $449,900 | -- | $379 / Sq Ft |
Purchase History
| Date | Type | Sale Price | Title Company |
|---|---|---|---|
| Condominium Deed | $230,000 | -- | |
| Deed | -- | -- | |
| Deed | $230,000 | -- | |
| Deed | $105,000 | -- |
Mortgage History
| Date | Status | Loan Amount | Loan Type |
|---|---|---|---|
| Open | $150,000 | New Conventional | |
| Previous Owner | $180,000 | No Value Available | |
| Previous Owner | $35,000 | Purchase Money Mortgage |
Source: MLS Property Information Network (MLS PIN)
MLS Number: 73454532
APN: WALP-000033-000160-000019
Disclaimer: Certain information contained herein is derived from information provided by parties other than Homes.com. All information provided is deemed reliable, but is not guaranteed to be accurate and should be independently verified.
![]() The property listing data and information, or the Images, set forth herein were provided to MLS Property Information Network, Inc. from third party sources, including sellers, lessors and public records, and were compiled by MLS Property Information Network, Inc. The property listing data and information, and the Images, are for the personal, non-commercial use of consumers having a good faith interest in purchasing or leasing listed properties of the type displayed to them and may not be used for any purpose other than to identify prospective properties which such consumers may have a good faith interest in purchasing or leasing. MLS Property Information Network, Inc. and its subscribers disclaim any and all representations and warranties as to the accuracy of the property listing data and information, or as to the accuracy of any of the Images, set forth herein.
The property listing data and information, or the Images, set forth herein were provided to MLS Property Information Network, Inc. from third party sources, including sellers, lessors and public records, and were compiled by MLS Property Information Network, Inc. The property listing data and information, and the Images, are for the personal, non-commercial use of consumers having a good faith interest in purchasing or leasing listed properties of the type displayed to them and may not be used for any purpose other than to identify prospective properties which such consumers may have a good faith interest in purchasing or leasing. MLS Property Information Network, Inc. and its subscribers disclaim any and all representations and warranties as to the accuracy of the property listing data and information, or as to the accuracy of any of the Images, set forth herein.
- 145 South St Unit 5
- 8 Autumn Ln
- 224 School St Unit 10
- 1391 Main St Unit 304
- 1391 Main St Unit 208
- 1391 Main St Unit 305
- 1391 Main St Unit 308
- 103 Centre Ln
- 305 Centre Ln
- 18 Teal Cir
- 24 Pelican Dr
- 1156 Washington St
- 127 Clear Pond Dr
- 137 Clear Pond Dr
- 16 Magpie Cir Unit 16
- 881 Main St Unit 9
- 8 Rainbow Pond Dr Unit 8
- 31 Sandtrap Cir Unit 5
- 10 Sandtrap Cir Unit 2
- 13 Sandtrap Cir Unit 14
