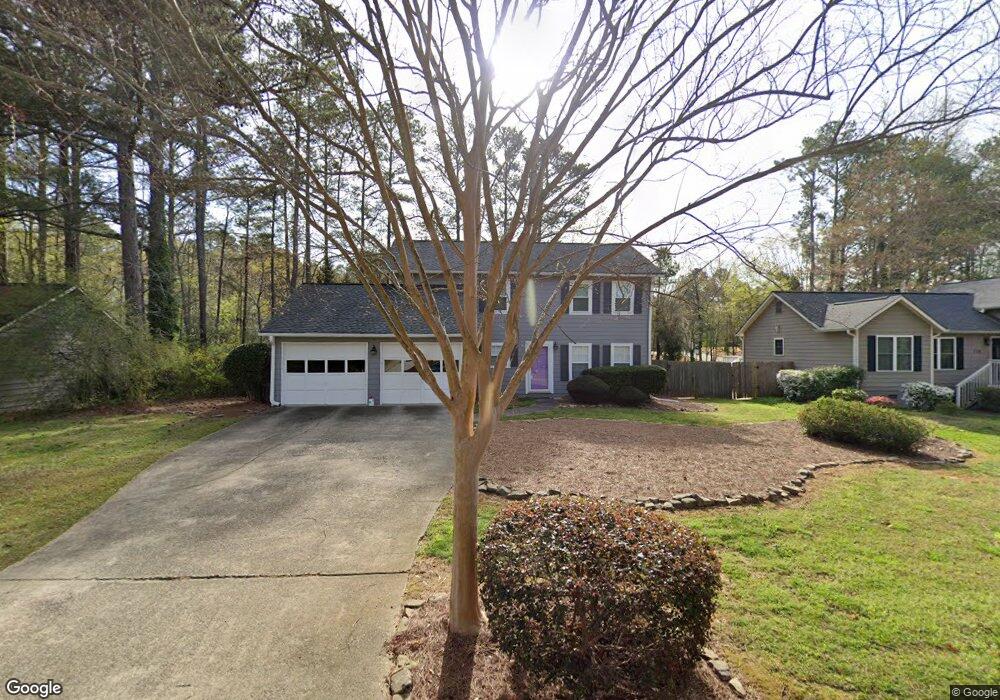
145 Tyson Cir Roswell, GA 30076
Estimated Value: $469,421 - $504,000
4
Beds
3
Baths
1,921
Sq Ft
$256/Sq Ft
Est. Value
About This Home
This home is located at 145 Tyson Cir, Roswell, GA 30076 and is currently estimated at $492,355, approximately $256 per square foot. 145 Tyson Cir is a home located in Fulton County with nearby schools including Northwood Elementary School, Haynes Bridge Middle School, and Centennial High School.
Ownership History
Date
Name
Owned For
Owner Type
Purchase Details
Closed on
Nov 25, 2009
Sold by
Montgomery James M and Montgomery Christina
Bought by
Walton Shandra L
Current Estimated Value
Home Financials for this Owner
Home Financials are based on the most recent Mortgage that was taken out on this home.
Original Mortgage
$218,960
Outstanding Balance
$147,151
Interest Rate
5.5%
Mortgage Type
FHA
Estimated Equity
$345,204
Purchase Details
Closed on
Jun 24, 2004
Sold by
Thomas Timothy E and Thomas Kathy
Bought by
Montgomery James M and Montgomery Christina
Home Financials for this Owner
Home Financials are based on the most recent Mortgage that was taken out on this home.
Original Mortgage
$162,400
Interest Rate
6.25%
Mortgage Type
New Conventional
Create a Home Valuation Report for This Property
The Home Valuation Report is an in-depth analysis detailing your home's value as well as a comparison with similar homes in the area
Home Values in the Area
Average Home Value in this Area
Purchase History
| Date | Buyer | Sale Price | Title Company |
|---|---|---|---|
| Walton Shandra L | $223,000 | -- | |
| Montgomery James M | $203,000 | -- |
Source: Public Records
Mortgage History
| Date | Status | Borrower | Loan Amount |
|---|---|---|---|
| Open | Walton Shandra L | $218,960 | |
| Previous Owner | Montgomery James M | $162,400 |
Source: Public Records
Tax History Compared to Growth
Tax History
| Year | Tax Paid | Tax Assessment Tax Assessment Total Assessment is a certain percentage of the fair market value that is determined by local assessors to be the total taxable value of land and additions on the property. | Land | Improvement |
|---|---|---|---|---|
| 2025 | $499 | $155,720 | $38,760 | $116,960 |
| 2023 | $4,481 | $158,760 | $39,480 | $119,280 |
| 2022 | $1,911 | $137,760 | $24,960 | $112,800 |
| 2021 | $2,274 | $116,320 | $28,440 | $87,880 |
| 2020 | $2,306 | $109,680 | $26,640 | $83,040 |
| 2019 | $388 | $107,720 | $26,160 | $81,560 |
| 2018 | $2,268 | $99,040 | $19,520 | $79,520 |
| 2017 | $1,802 | $73,720 | $12,360 | $61,360 |
| 2016 | $1,801 | $73,720 | $12,360 | $61,360 |
| 2015 | $2,210 | $73,720 | $12,360 | $61,360 |
| 2014 | $1,869 | $73,720 | $12,360 | $61,360 |
Source: Public Records
Map
Nearby Homes
- 115 Ansley Ct
- 500 Barrington Dr W
- 1835 Old Alabama Rd
- 515 Forest Place
- 9985 Lake Forest Way
- 620 Lake Forest Ct
- 680 Barrington Way
- 650 Lake Forest Ct
- 125 Maison Ct
- 295 Crab Orchard Way
- 105 Laurel Mill Ct
- 780 Crab Orchard Dr
- 1220 Terramont Dr
- 590 Ridgemont Dr
- 485 Sheringham Ct
- 600 Jardin Ct Unit 48
- 260 Spring Ridge Dr
- 1095 Northpointe Trace
- 135 Tyson Cir
- 155 Tyson Cir Unit 2
- 125 Tyson Cir Unit 1
- 165 Tyson Cir
- 150 Tyson Cir
- 10140 Wooten Rd
- 10132 Wooten Rd
- 160 Tyson Cir Unit 2
- 10142 Wooten Rd
- 10130 Wooten Rd
- 0 Wooten Rd Unit 7068775
- 0 Wooten Rd Unit 8688622
- 0 Wooten Rd Unit 8661853
- 0 Wooten Rd Unit 7567082
- 0 Wooten Rd Unit 7566737
- 0 Wooten Rd Unit 8705612
- 0 Wooten Rd Unit 8620611
- 0 Wooten Rd Unit 8754524
- 0 Wooten Rd
- 10150 Wooten Rd