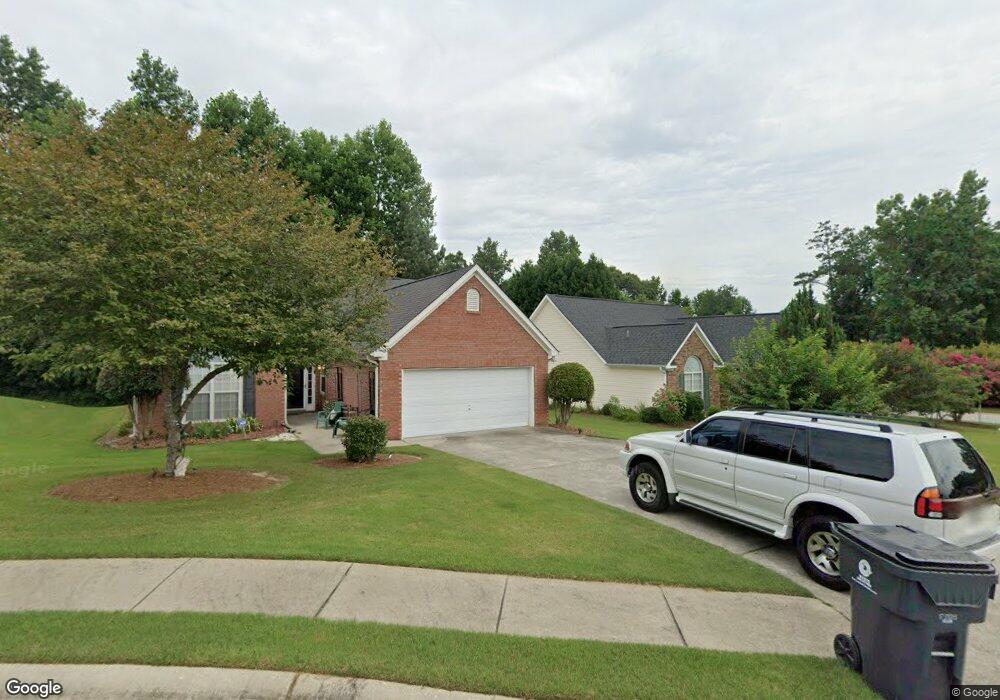
145 Vines Ct Fayetteville, GA 30215
Estimated Value: $295,000 - $324,361
--
Bed
2
Baths
1,491
Sq Ft
$209/Sq Ft
Est. Value
About This Home
This home is located at 145 Vines Ct, Fayetteville, GA 30215 and is currently estimated at $312,090, approximately $209 per square foot. 145 Vines Ct is a home located in Fayette County with nearby schools including Spring Hill Elementary School, Bennett's Mill Middle School, and Fayette County High School.
Ownership History
Date
Name
Owned For
Owner Type
Purchase Details
Closed on
Jul 1, 2025
Sold by
Lall Abhilasha
Bought by
Lall Abhilasha and Lall Aakash
Current Estimated Value
Purchase Details
Closed on
Apr 1, 2021
Sold by
Walther Paul C
Bought by
Lall Abhilasha
Home Financials for this Owner
Home Financials are based on the most recent Mortgage that was taken out on this home.
Original Mortgage
$173,300
Interest Rate
3%
Mortgage Type
New Conventional
Purchase Details
Closed on
Dec 11, 2006
Sold by
Upchurch Mary A
Bought by
Walther Paul C and Walther Jill S
Purchase Details
Closed on
Feb 15, 2000
Sold by
Hayes Dev Corp
Bought by
Upchurch Mary A
Home Financials for this Owner
Home Financials are based on the most recent Mortgage that was taken out on this home.
Original Mortgage
$104,500
Interest Rate
8.17%
Mortgage Type
New Conventional
Create a Home Valuation Report for This Property
The Home Valuation Report is an in-depth analysis detailing your home's value as well as a comparison with similar homes in the area
Home Values in the Area
Average Home Value in this Area
Purchase History
| Date | Buyer | Sale Price | Title Company |
|---|---|---|---|
| Lall Abhilasha | -- | None Listed On Document | |
| Lall Abhilasha | -- | None Listed On Document | |
| Lall Abhilasha | $182,500 | -- | |
| Walther Paul C | $175,000 | -- | |
| Upchurch Mary A | $134,500 | -- |
Source: Public Records
Mortgage History
| Date | Status | Borrower | Loan Amount |
|---|---|---|---|
| Previous Owner | Lall Abhilasha | $173,300 | |
| Previous Owner | Upchurch Mary A | $104,500 |
Source: Public Records
Tax History Compared to Growth
Tax History
| Year | Tax Paid | Tax Assessment Tax Assessment Total Assessment is a certain percentage of the fair market value that is determined by local assessors to be the total taxable value of land and additions on the property. | Land | Improvement |
|---|---|---|---|---|
| 2024 | $2,775 | $130,128 | $23,200 | $106,928 |
| 2023 | $2,265 | $124,960 | $23,200 | $101,760 |
| 2022 | $2,156 | $73,000 | $9,760 | $63,240 |
| 2021 | $2,184 | $70,960 | $12,800 | $58,160 |
| 2020 | $2,078 | $67,200 | $12,800 | $54,400 |
| 2019 | $2,181 | $69,840 | $12,800 | $57,040 |
| 2018 | $2,088 | $66,160 | $12,800 | $53,360 |
| 2017 | $1,887 | $63,120 | $12,800 | $50,320 |
| 2016 | $1,602 | $52,440 | $12,800 | $39,640 |
| 2015 | $1,521 | $48,880 | $12,800 | $36,080 |
| 2014 | $1,420 | $44,800 | $12,800 | $32,000 |
| 2013 | -- | $45,160 | $0 | $0 |
Source: Public Records
Map
Nearby Homes
- 865 Virginia Highlands
- 115 Cloverwood Dr
- 210 Pecan Ridge Dr Unit 2
- 310 Autumn Glen Cir
- 1115 Highway 54 E
- 1119 Highway 54 E
- 0 Dixon Extension
- 0 Callaway Rd Unit 10333361
- 115 Linda Way
- The Bradford Plan at Mitchell Estates
- The Mildred Plan at Mitchell Estates
- 210 Rosewood Dr
- 135 Knights Ct
- NONE OR ZERO S Jeff Davis Dr
- 130 Thrushwood Dr
- 225 Buckeye Ln Unit 2
- 500 Circle Dr
- 190 Brierwood Dr Unit 3
- 1202 Highway 54 E
- 865 S Jeff Davis Dr
- 160 Brookestone Point
- 155 Vines Ct
- 170 Brookestone Point
- 165 Vines Ct Unit Ga1400
- 165 Vines Ct
- 165 Vines Ct Unit GA14005
- 0 Vines Ct Unit 7364094
- 0 Vines Ct Unit 7053493
- 0 Vines Ct Unit 8452540
- 180 Brookestone Point
- 130 Vines Ct
- 120 Vines Ct
- 170 Vines Ct
- 155 Brookestone Point
- 140 Vines Ct
- 160 Vines Ct
- 110 Vines Ct
- 165 Brookestone Point
- 150 Vines Ct
- 175 Brookestone Point