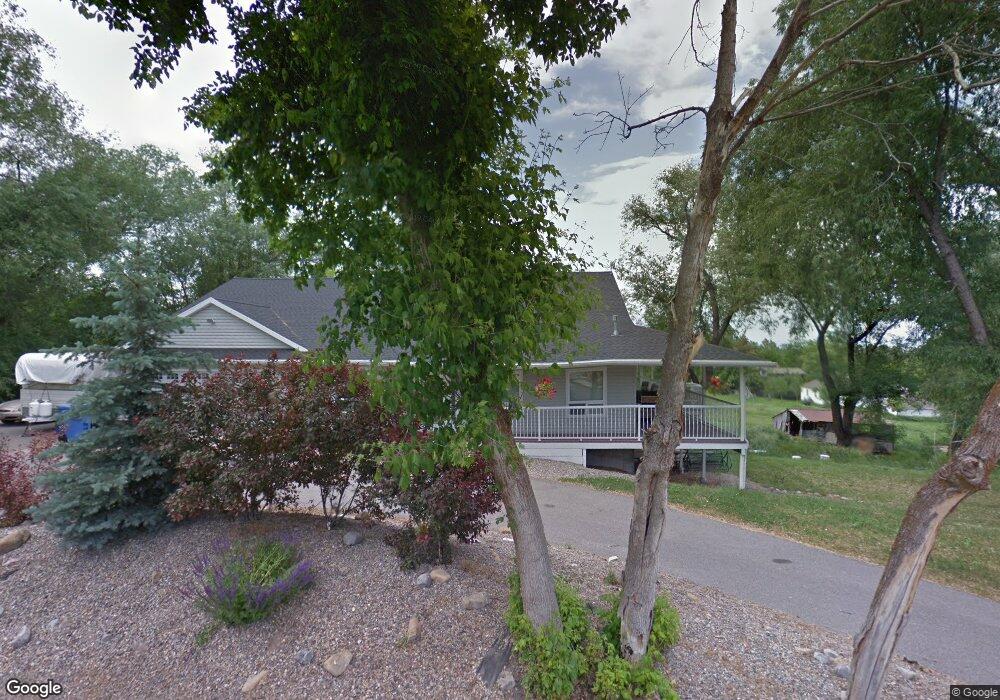
145 W 200 S Mendon, UT 84325
Estimated Value: $674,000 - $844,000
--
Bed
--
Bath
1,949
Sq Ft
$396/Sq Ft
Est. Value
About This Home
This home is located at 145 W 200 S, Mendon, UT 84325 and is currently estimated at $770,942, approximately $395 per square foot. 145 W 200 S is a home with nearby schools including Mountainside School, South Cache Middle School, and Mountain Crest High School.
Ownership History
Date
Name
Owned For
Owner Type
Purchase Details
Closed on
Nov 13, 2017
Sold by
Swan Brandon D and Swan Shara
Bought by
Swan Brandon and Swan Shara
Current Estimated Value
Home Financials for this Owner
Home Financials are based on the most recent Mortgage that was taken out on this home.
Original Mortgage
$272,700
Outstanding Balance
$230,706
Interest Rate
4.22%
Mortgage Type
New Conventional
Estimated Equity
$540,236
Purchase Details
Closed on
Sep 2, 2016
Sold by
Swan Brandon D
Bought by
Swan Brandon D and Swan Shara
Home Financials for this Owner
Home Financials are based on the most recent Mortgage that was taken out on this home.
Original Mortgage
$275,793
Interest Rate
3.43%
Mortgage Type
FHA
Create a Home Valuation Report for This Property
The Home Valuation Report is an in-depth analysis detailing your home's value as well as a comparison with similar homes in the area
Home Values in the Area
Average Home Value in this Area
Purchase History
| Date | Buyer | Sale Price | Title Company |
|---|---|---|---|
| Swan Brandon | -- | -- | |
| Swan Brandon D | -- | None Available |
Source: Public Records
Mortgage History
| Date | Status | Borrower | Loan Amount |
|---|---|---|---|
| Open | Swan Brandon | $272,700 | |
| Previous Owner | Swan Brandon D | $275,793 |
Source: Public Records
Tax History Compared to Growth
Tax History
| Year | Tax Paid | Tax Assessment Tax Assessment Total Assessment is a certain percentage of the fair market value that is determined by local assessors to be the total taxable value of land and additions on the property. | Land | Improvement |
|---|---|---|---|---|
| 2025 | $3,095 | $409,520 | $0 | $0 |
| 2024 | $3,302 | $409,520 | $0 | $0 |
| 2023 | $3,201 | $377,135 | $0 | $0 |
| 2022 | $32 | $377,135 | $0 | $0 |
| 2021 | $2,678 | $466,545 | $75,000 | $391,545 |
| 2020 | $2,338 | $376,197 | $75,000 | $301,197 |
| 2019 | $2,464 | $376,196 | $75,000 | $301,196 |
| 2018 | $2,218 | $336,910 | $75,000 | $261,910 |
| 2017 | $2,165 | $174,455 | $0 | $0 |
| 2016 | $2,140 | $167,455 | $0 | $0 |
| 2015 | $1,855 | $150,090 | $0 | $0 |
| 2014 | $1,811 | $150,090 | $0 | $0 |
| 2013 | -- | $150,090 | $0 | $0 |
Source: Public Records
Map
Nearby Homes
- 1811 S 5900 W
- 915 W 50 N Unit 67
- 847 W 50 N Unit 69
- 848 N 100 E Unit 73
- 1200 S 5400 W Unit 13
- 535 Pheaant Hollow Ln
- 518 N 220 E
- 203 E 600 N
- 876 N 75 W Unit 9
- 967 N 75 W Unit 63
- 59 W 1050 N Unit 18
- 993 N 75 W Unit 64
- 948 N 75 W Unit 11
- 42 W 850 N Unit 5
- 1044 N 75 W Unit 15
- 850 N 51 W Unit 59
- 74 W 850 N Unit 7
- 915 N 75 W Unit 61
- 850 N 73 W Unit 60
- 26 W 850 N Unit 4