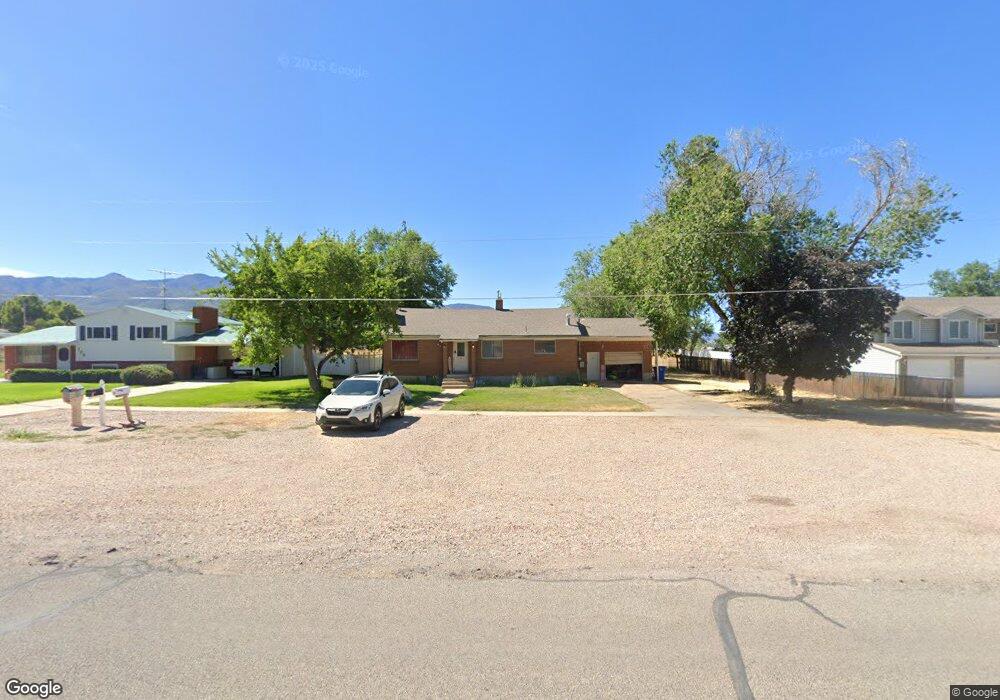
145 W 300 S Fillmore, UT 84631
Estimated Value: $291,000 - $399,000
5
Beds
2
Baths
3,052
Sq Ft
$120/Sq Ft
Est. Value
About This Home
This home is located at 145 W 300 S, Fillmore, UT 84631 and is currently estimated at $367,542, approximately $120 per square foot. 145 W 300 S is a home located in Millard County.
Ownership History
Date
Name
Owned For
Owner Type
Purchase Details
Closed on
May 10, 2021
Sold by
Dk Properties Services Llc
Bought by
Quarnberg Kelsey and Quarnberg Cole A
Current Estimated Value
Home Financials for this Owner
Home Financials are based on the most recent Mortgage that was taken out on this home.
Original Mortgage
$152,000
Outstanding Balance
$137,163
Interest Rate
3.1%
Mortgage Type
New Conventional
Estimated Equity
$230,379
Purchase Details
Closed on
Nov 16, 2020
Sold by
Faulkner Patrea
Bought by
Dk Property Services Llc
Purchase Details
Closed on
Oct 10, 2020
Sold by
Dk Property Services Llc
Bought by
Faulkner Patrea and Rasmusson Living Trust
Purchase Details
Closed on
Nov 16, 2007
Sold by
Rasmusson Patricia J
Bought by
Prows Steve L and Prows Mary K
Home Financials for this Owner
Home Financials are based on the most recent Mortgage that was taken out on this home.
Original Mortgage
$107,000
Interest Rate
6.36%
Create a Home Valuation Report for This Property
The Home Valuation Report is an in-depth analysis detailing your home's value as well as a comparison with similar homes in the area
Home Values in the Area
Average Home Value in this Area
Purchase History
| Date | Buyer | Sale Price | Title Company |
|---|---|---|---|
| Quarnberg Kelsey | -- | None Available | |
| Dk Property Services Llc | -- | None Available | |
| Faulkner Patrea | -- | First Title Insurance Agency | |
| Prows Steve L | -- | -- |
Source: Public Records
Mortgage History
| Date | Status | Borrower | Loan Amount |
|---|---|---|---|
| Open | Quarnberg Kelsey | $152,000 | |
| Previous Owner | Prows Steve L | $107,000 |
Source: Public Records
Tax History Compared to Growth
Tax History
| Year | Tax Paid | Tax Assessment Tax Assessment Total Assessment is a certain percentage of the fair market value that is determined by local assessors to be the total taxable value of land and additions on the property. | Land | Improvement |
|---|---|---|---|---|
| 2025 | $1,479 | $185,704 | $45,600 | $140,104 |
| 2024 | $1,479 | $161,393 | $34,967 | $126,426 |
| 2023 | $1,530 | $161,393 | $34,967 | $126,426 |
| 2022 | $1,431 | $128,465 | $31,445 | $97,020 |
| 2021 | $1,228 | $105,889 | $20,419 | $85,470 |
| 2020 | $1,136 | $98,489 | $18,563 | $79,926 |
| 2019 | $979 | $85,120 | $18,563 | $66,557 |
| 2018 | $935 | $83,243 | $18,563 | $64,680 |
| 2017 | $860 | $72,802 | $18,563 | $54,239 |
| 2016 | $823 | $72,802 | $18,563 | $54,239 |
| 2015 | $823 | $72,802 | $18,563 | $54,239 |
| 2014 | -- | $72,802 | $18,563 | $54,239 |
| 2013 | -- | $72,802 | $18,563 | $54,239 |
Source: Public Records
Map
Nearby Homes
- 190 W 400 St S
- 220 S 200 E
- 155 E 500 St S
- 157 E 500 South St
- 310 S 500 West Rd
- 40 S 100 Rd E
- 75 N 100 West St
- 405 E 500 St S
- 165 N 100 W
- 225 W 200 St N
- 430 E Canyon Rd
- 295 N 100 West St
- 310 S 600 E
- 760 E 700 St S
- 380 N 200 St W
- 390 N 100 W
- 335 W 400 North St
- 690 E 500 S
- 1100 S 725 Rd W
- 750 800 South Fillmore