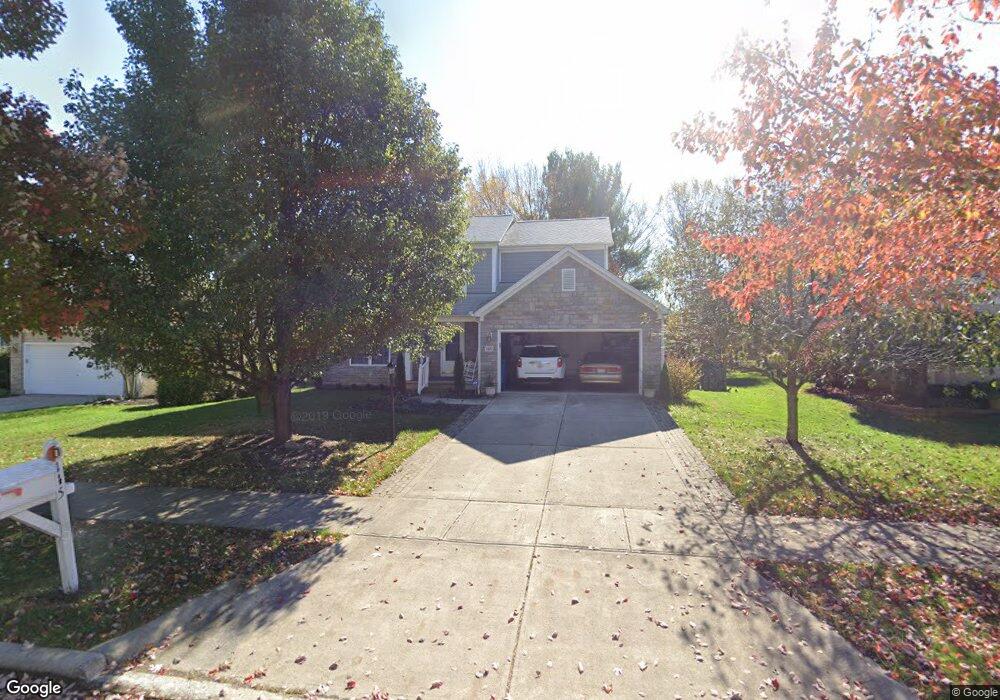
145 W Hull Dr Delaware, OH 43015
Estimated Value: $415,000 - $488,000
4
Beds
3
Baths
2,181
Sq Ft
$203/Sq Ft
Est. Value
About This Home
This home is located at 145 W Hull Dr, Delaware, OH 43015 and is currently estimated at $442,914, approximately $203 per square foot. 145 W Hull Dr is a home located in Delaware County with nearby schools including Laura Woodward Elementary School, John C. Dempsey Middle School, and Rutherford B. Hayes High School.
Ownership History
Date
Name
Owned For
Owner Type
Purchase Details
Closed on
Aug 6, 2007
Sold by
Primacy Closing Corp
Bought by
Shephard Billy M and Shephard Mary E
Current Estimated Value
Home Financials for this Owner
Home Financials are based on the most recent Mortgage that was taken out on this home.
Original Mortgage
$89,900
Outstanding Balance
$57,095
Interest Rate
6.72%
Mortgage Type
Purchase Money Mortgage
Estimated Equity
$385,820
Purchase Details
Closed on
Mar 23, 2007
Sold by
Flavell Gary H and Flavell Jennifer E
Bought by
Primacy Closing Corp
Purchase Details
Closed on
Jul 13, 2001
Sold by
Rockford Homes Inc
Bought by
Flavell Gary H Jennifer E
Home Financials for this Owner
Home Financials are based on the most recent Mortgage that was taken out on this home.
Original Mortgage
$145,900
Interest Rate
7.27%
Mortgage Type
New Conventional
Purchase Details
Closed on
Feb 27, 2001
Sold by
Ptns Rockdel
Bought by
Rockford Homes Inc
Create a Home Valuation Report for This Property
The Home Valuation Report is an in-depth analysis detailing your home's value as well as a comparison with similar homes in the area
Home Values in the Area
Average Home Value in this Area
Purchase History
| Date | Buyer | Sale Price | Title Company |
|---|---|---|---|
| Shephard Billy M | $209,900 | First American | |
| Primacy Closing Corp | $209,900 | First American | |
| Flavell Gary H Jennifer E | $182,393 | -- | |
| Rockford Homes Inc | $25,000 | -- |
Source: Public Records
Mortgage History
| Date | Status | Borrower | Loan Amount |
|---|---|---|---|
| Open | Shephard Billy M | $89,900 | |
| Previous Owner | Flavell Gary H Jennifer E | $145,900 |
Source: Public Records
Tax History Compared to Growth
Tax History
| Year | Tax Paid | Tax Assessment Tax Assessment Total Assessment is a certain percentage of the fair market value that is determined by local assessors to be the total taxable value of land and additions on the property. | Land | Improvement |
|---|---|---|---|---|
| 2024 | $5,025 | $116,240 | $18,060 | $98,180 |
| 2023 | $5,065 | $116,240 | $18,060 | $98,180 |
| 2022 | $4,409 | $89,640 | $16,100 | $73,540 |
| 2021 | $4,506 | $89,640 | $16,100 | $73,540 |
| 2020 | $4,558 | $89,640 | $16,100 | $73,540 |
| 2019 | $4,137 | $75,290 | $14,000 | $61,290 |
| 2018 | $4,194 | $75,290 | $14,000 | $61,290 |
| 2017 | $4,154 | $70,360 | $11,520 | $58,840 |
| 2016 | $3,544 | $70,360 | $11,520 | $58,840 |
| 2015 | $3,563 | $70,360 | $11,520 | $58,840 |
| 2014 | $3,620 | $70,360 | $11,520 | $58,840 |
| 2013 | $3,475 | $67,560 | $11,520 | $56,040 |
Source: Public Records
Map
Nearby Homes
- 45 Elba Crt
- 144 Wagner Way
- 1410 Stratford Rd
- 123 Hawthorn Blvd
- 13 Birch Row Dr
- 21 Birch Row Dr
- 45 Elba Ct
- 19 Winter Pine Dr
- 8 Winter Pine Dr
- 50 Birch Row Dr
- 25 Ravine Ridge Dr
- 36 Ravine Ridge Dr
- 4 Ravine Ridge Dr
- 181 Campo St
- 860 Village Dr Unit 860
- 857 Village Dr Unit 857
- 61 Corsica Way
- 102 Corsica Way
- 86 Belle Ave
- 354 Passina Rd