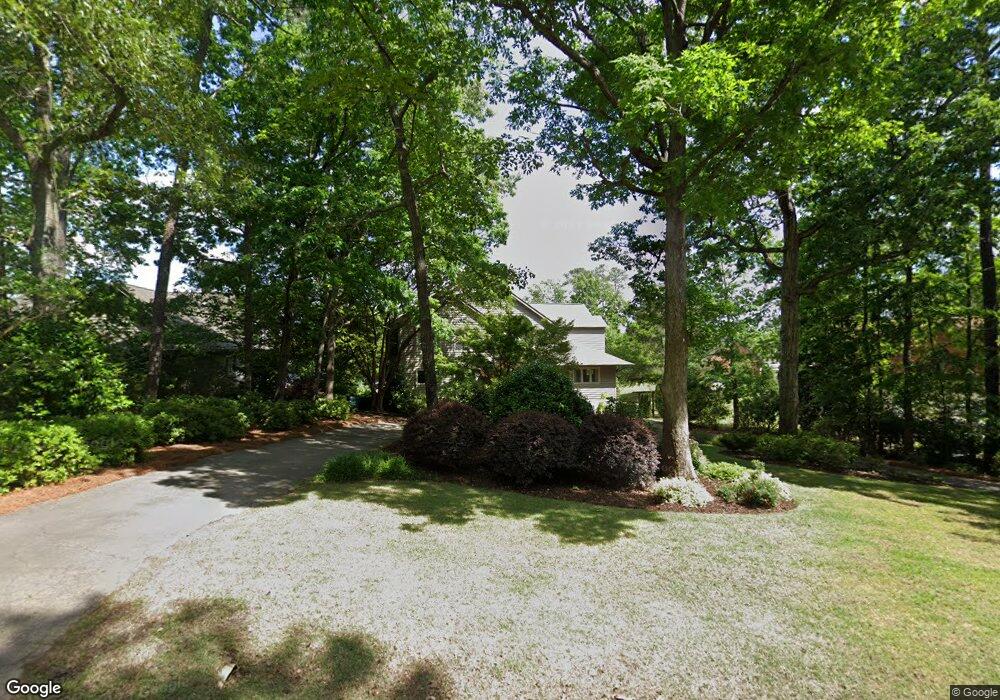
145 Waxhaws Trace Chapin, SC 29036
Estimated Value: $560,000 - $901,807
4
Beds
5
Baths
3,282
Sq Ft
$228/Sq Ft
Est. Value
About This Home
This home is located at 145 Waxhaws Trace, Chapin, SC 29036 and is currently estimated at $748,952, approximately $228 per square foot. 145 Waxhaws Trace is a home with nearby schools including Lake Murray Elementary School, Chapin Intermediate, and Chapin High School.
Ownership History
Date
Name
Owned For
Owner Type
Purchase Details
Closed on
Aug 22, 2006
Sold by
Kirkland Mary Evon and Mcangus Mary Evon
Bought by
Mcangus W Hugh and Mcangus Mary Evon
Current Estimated Value
Home Financials for this Owner
Home Financials are based on the most recent Mortgage that was taken out on this home.
Original Mortgage
$654,400
Interest Rate
6.67%
Mortgage Type
New Conventional
Purchase Details
Closed on
Dec 22, 2005
Sold by
Mcangus Mary Evon
Bought by
Mcangus W Hugh and Mcangus Mary Evon
Home Financials for this Owner
Home Financials are based on the most recent Mortgage that was taken out on this home.
Original Mortgage
$350,000
Interest Rate
6.19%
Mortgage Type
Future Advance Clause Open End Mortgage
Purchase Details
Closed on
Jun 10, 2004
Sold by
Melvin W Brinkley
Bought by
Kirkland Mary E
Purchase Details
Closed on
May 26, 2004
Sold by
Clemens Jim A
Bought by
Chamberlain Cleo W
Create a Home Valuation Report for This Property
The Home Valuation Report is an in-depth analysis detailing your home's value as well as a comparison with similar homes in the area
Home Values in the Area
Average Home Value in this Area
Purchase History
| Date | Buyer | Sale Price | Title Company |
|---|---|---|---|
| Mcangus W Hugh | -- | None Available | |
| Mcangus W Hugh | -- | None Available | |
| Kirkland Mary E | $375,000 | -- | |
| Chamberlain Cleo W | $132,000 | -- |
Source: Public Records
Mortgage History
| Date | Status | Borrower | Loan Amount |
|---|---|---|---|
| Closed | Mcangus W Hugh | $654,400 | |
| Closed | Mcangus W Hugh | $350,000 |
Source: Public Records
Tax History
| Year | Tax Paid | Tax Assessment Tax Assessment Total Assessment is a certain percentage of the fair market value that is determined by local assessors to be the total taxable value of land and additions on the property. | Land | Improvement |
|---|---|---|---|---|
| 2024 | $3,798 | $23,052 | $8,800 | $14,252 |
| 2023 | $3,526 | $23,052 | $8,800 | $14,252 |
| 2022 | $3,558 | $23,052 | $8,800 | $14,252 |
| 2020 | $3,726 | $23,052 | $8,800 | $14,252 |
| 2019 | $3,468 | $21,093 | $7,168 | $13,925 |
| 2018 | $3,053 | $21,093 | $7,168 | $13,925 |
| 2017 | $2,974 | $21,093 | $7,168 | $13,925 |
| 2016 | $3,049 | $21,092 | $7,168 | $13,924 |
| 2014 | $2,987 | $20,740 | $6,210 | $14,530 |
| 2013 | -- | $20,740 | $6,210 | $14,530 |
Source: Public Records
Map
Nearby Homes
- 435 Whits End
- 24 Clay Ct
- 403 Rising Stream Way
- 345 Rising Stream Way
- 407 Rising Stream Way
- 419 Rising Stream Way
- 343 Rising Stream Way
- 237 Timber Wood Dr
- 337 Rising Stream Way
- 427 Rising Stream Way
- 932 Trident Maple Ln
- 414 Rising Stream Way
- 314 Rising Stream Way
- 734 Autumn Shiloh Dr
- 306 Rising Stream Way
- 302 Rising Stream Way
- 623 Autumn Shiloh Dr
- 622 Autumn Shiloh Dr
- 116 Currioman Dr
- 335 Saucer Way
- 147 Waxhaws Trace
- 127 Smiths Ford Rd
- 135 Smiths Ford Rd
- 143 Waxhaws Trace
- 150 Waxhaws Trace
- 140 Waxhaws Trace
- 139 Waxhaws Trace
- 128 Smiths Ford Rd
- 139 Smiths Ford Rd
- 132 Smiths Ford Rd
- 120 Smiths Ford Rd
- 136 Smiths Ford Rd
- 115 Smiths Ford Rd
- 133 Waxhaws Trace
- 128 Waxhaws Trace
- 144 Smiths Ford Rd
- 122 Waxhaws Trace
- 131 Waxhaws Trace
- 129 Waxhaws Trace
- 107 Smiths Ford Rd
Your Personal Tour Guide
Ask me questions while you tour the home.