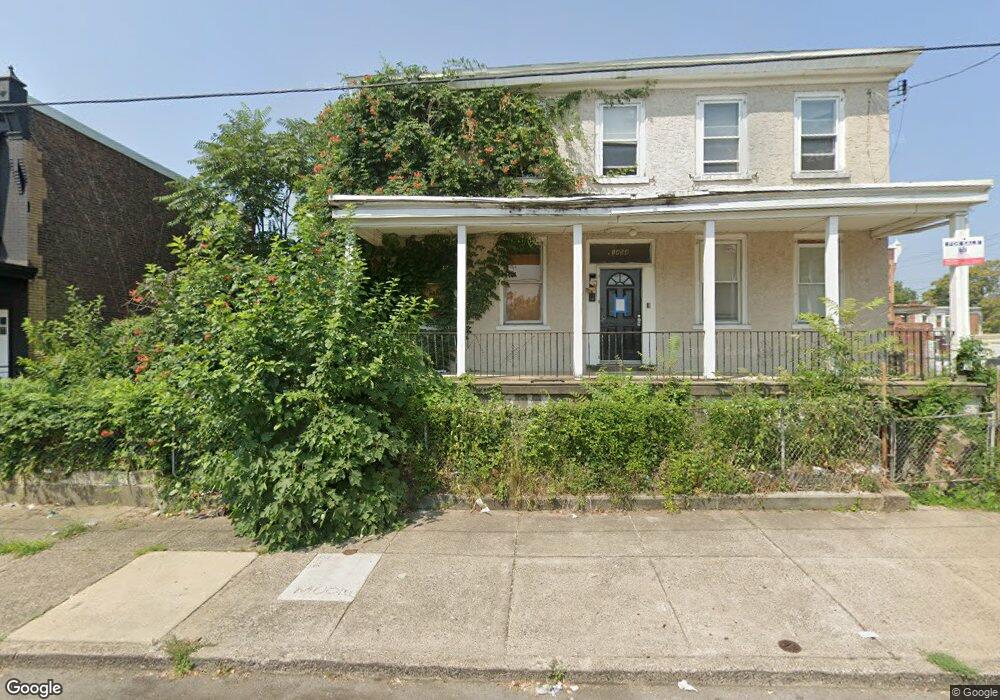
1450-56 N Peach St Philadelphia, PA 19131
Carroll Park NeighborhoodEstimated Value: $245,000 - $293,000
--
Bed
--
Bath
2,610
Sq Ft
$103/Sq Ft
Est. Value
About This Home
This home is located at 1450-56 N Peach St, Philadelphia, PA 19131 and is currently estimated at $269,000, approximately $103 per square foot. 1450-56 N Peach St is a home located in Philadelphia County with nearby schools including Edward Heston School, Overbrook High School, and Universal Bluford Charter School.
Ownership History
Date
Name
Owned For
Owner Type
Purchase Details
Closed on
Feb 16, 2024
Sold by
1450-56 N Peach Street Llc
Bought by
Quatre Management Llc
Current Estimated Value
Home Financials for this Owner
Home Financials are based on the most recent Mortgage that was taken out on this home.
Original Mortgage
$250,000
Interest Rate
6.82%
Mortgage Type
Construction
Purchase Details
Closed on
Jun 7, 2019
Sold by
Wyatt Bey Tahira
Bought by
1450 56 N Peach St Llc
Purchase Details
Closed on
Mar 1, 2019
Sold by
Wyatt-Barriner Beverly and Wyatt-Bey Tahira
Bought by
Wyatt-Bey Tahira
Purchase Details
Closed on
Oct 26, 2016
Sold by
Waytt Barriner Beverly
Bought by
Waytt Barriner Beverly and Waytt Bey Tahira
Purchase Details
Closed on
Jul 25, 2016
Sold by
Maddox Bryan
Bought by
Wyatt Barriner Beverly
Create a Home Valuation Report for This Property
The Home Valuation Report is an in-depth analysis detailing your home's value as well as a comparison with similar homes in the area
Home Values in the Area
Average Home Value in this Area
Purchase History
| Date | Buyer | Sale Price | Title Company |
|---|---|---|---|
| Quatre Management Llc | $250,000 | None Listed On Document | |
| 1450 56 N Peach St Llc | $100,000 | None Available | |
| Wyatt-Bey Tahira | -- | None Available | |
| Waytt Barriner Beverly | -- | None Available | |
| Wyatt Barriner Beverly | -- | None Available |
Source: Public Records
Mortgage History
| Date | Status | Borrower | Loan Amount |
|---|---|---|---|
| Previous Owner | Quatre Management Llc | $250,000 |
Source: Public Records
Tax History Compared to Growth
Tax History
| Year | Tax Paid | Tax Assessment Tax Assessment Total Assessment is a certain percentage of the fair market value that is determined by local assessors to be the total taxable value of land and additions on the property. | Land | Improvement |
|---|---|---|---|---|
| 2025 | $2,431 | $263,400 | $52,680 | $210,720 |
| 2024 | $2,431 | $263,400 | $52,680 | $210,720 |
| 2023 | $4,752 | $173,700 | $34,740 | $138,960 |
| 2022 | $2,431 | $339,500 | $67,900 | $271,600 |
| 2021 | $2,431 | $0 | $0 | $0 |
| 2020 | $2,431 | $0 | $0 | $0 |
| 2019 | $2,340 | $0 | $0 | $0 |
| 2018 | $1,263 | $0 | $0 | $0 |
| 2017 | $1,263 | $0 | $0 | $0 |
| 2016 | $1,263 | $0 | $0 | $0 |
| 2015 | $1,209 | $0 | $0 | $0 |
| 2014 | -- | $90,200 | $21,668 | $68,532 |
| 2012 | -- | $14,368 | $2,822 | $11,546 |
Source: Public Records
Map
Nearby Homes
- 5112 Harlan St
- 5301 Master St
- 5332 Master St
- 5448 Media St
- 5410 12 Master St
- 1447 N 55th St
- 1510 N Conestoga St
- 5406 Master St
- 5408 Master St
- 5224 Harlan St
- 5414 22 Master St
- 5317 Kershaw St
- 1486 N Wilton St
- 1530 N Conestoga St
- 5212 Harlan St
- 4980 Kershaw St
- 5502 Media St
- 5215 Master St
- 1512 N 55th St
- 1524 N 55th St
- 1450 N Peach St Unit 56
- 1450 58 N Peach St
- 1450 N Peach Street 56
- 1448 N Peach St
- 1446 N Peach St
- 1444 N Peach St
- 1455 N 54th St
- 1453 N 54th St
- 1449 N 54th St
- 5334 Media St
- 1442 N Peach St
- 1451 N 54th St
- 1447 N 54th St
- 5336 Media St
- 1440 N Peach St
- 1445 N 54th St
- 5338 Media St
- 1449 N Peach St
- 1443 N 54th St
- 1447 N Peach St