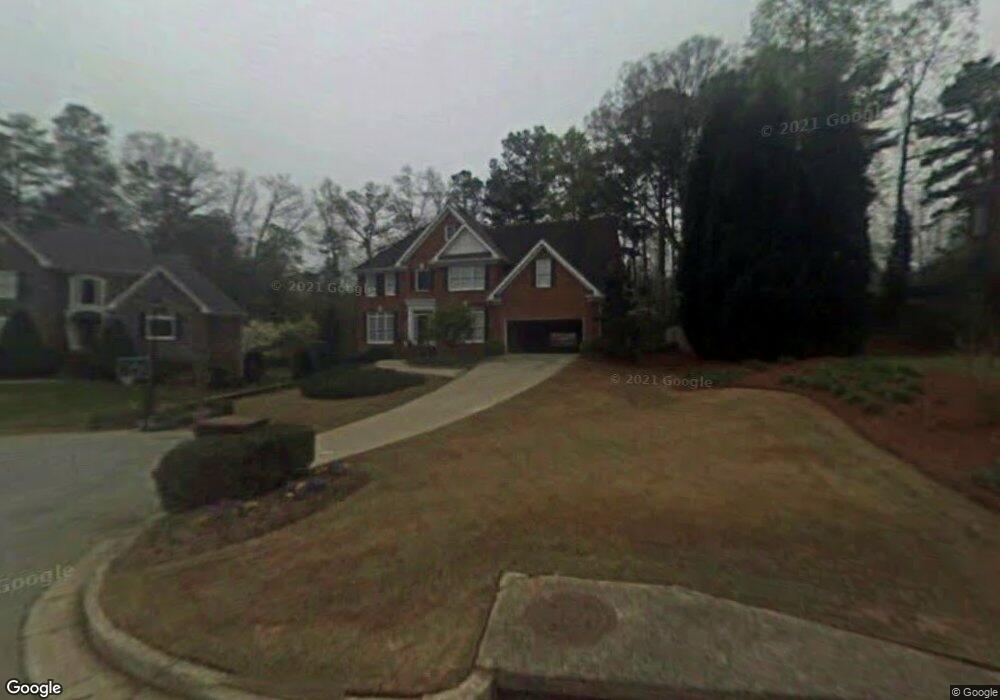
1450 Chinook Ct SW Lilburn, GA 30047
Estimated Value: $475,000 - $574,000
4
Beds
4
Baths
3,133
Sq Ft
$165/Sq Ft
Est. Value
About This Home
This home is located at 1450 Chinook Ct SW, Lilburn, GA 30047 and is currently estimated at $515,831, approximately $164 per square foot. 1450 Chinook Ct SW is a home located in Gwinnett County with nearby schools including Camp Creek Elementary School, Trickum Middle School, and Parkview High School.
Ownership History
Date
Name
Owned For
Owner Type
Purchase Details
Closed on
Dec 22, 2010
Sold by
Stone Charles R and Stone Patricia S
Bought by
Whitlock Christopher A and Whitlock Heather C
Current Estimated Value
Purchase Details
Closed on
Feb 12, 1999
Sold by
Waychoff Iii Charles R and Waychoff Iii Victori
Bought by
Whitlock Christopher A and Whitlock Hea
Home Financials for this Owner
Home Financials are based on the most recent Mortgage that was taken out on this home.
Original Mortgage
$212,000
Interest Rate
6.73%
Mortgage Type
New Conventional
Purchase Details
Closed on
Jan 4, 1994
Sold by
Copper Key Homes
Bought by
Waycliff Charles R
Home Financials for this Owner
Home Financials are based on the most recent Mortgage that was taken out on this home.
Original Mortgage
$209,600
Interest Rate
4.25%
Create a Home Valuation Report for This Property
The Home Valuation Report is an in-depth analysis detailing your home's value as well as a comparison with similar homes in the area
Home Values in the Area
Average Home Value in this Area
Purchase History
| Date | Buyer | Sale Price | Title Company |
|---|---|---|---|
| Whitlock Christopher A | -- | -- | |
| Whitlock Christopher A | $265,000 | -- | |
| Waycliff Charles R | $232,900 | -- |
Source: Public Records
Mortgage History
| Date | Status | Borrower | Loan Amount |
|---|---|---|---|
| Previous Owner | Whitlock Christopher A | $212,000 | |
| Previous Owner | Waycliff Charles R | $209,600 |
Source: Public Records
Tax History Compared to Growth
Tax History
| Year | Tax Paid | Tax Assessment Tax Assessment Total Assessment is a certain percentage of the fair market value that is determined by local assessors to be the total taxable value of land and additions on the property. | Land | Improvement |
|---|---|---|---|---|
| 2025 | $5,550 | $191,560 | $36,000 | $155,560 |
| 2024 | $5,727 | $193,040 | $36,000 | $157,040 |
| 2023 | $5,727 | $205,840 | $35,600 | $170,240 |
| 2022 | $5,498 | $183,400 | $42,800 | $140,600 |
| 2021 | $4,773 | $144,640 | $22,400 | $122,240 |
| 2020 | $4,807 | $144,640 | $22,400 | $122,240 |
| 2019 | $4,393 | $132,000 | $22,400 | $109,600 |
| 2018 | $4,401 | $132,000 | $22,400 | $109,600 |
| 2016 | $3,935 | $109,680 | $18,000 | $91,680 |
| 2015 | $4,054 | $113,200 | $18,000 | $95,200 |
| 2014 | -- | $113,200 | $18,000 | $95,200 |
Source: Public Records
Map
Nearby Homes
- 1530 Oleander Ln SW
- 4377 Hardwood Cir SW Unit 2
- 4327 Saint Michaels Dr SW
- 1102 Timber Glen Ct SW
- 1296 Lake Lucerne Rd SW
- 0 River Club Dr Unit 7650571
- 4405 Bending River Trail SW
- 1394 Rustlewood Ct SW
- 4665 Redspruce Dr SW
- 112 Hunley Ln
- 4070 Runnymede Dr SW
- 4166 Signal Ridge SW
- 1337 Arlene Ct SW
- 1535 Pathfinder Way SW Unit 1
- 4254 Russet Ct SW
- 4171 Whispering Forest Ct SW
- 4107 Signal Ridge SW
- 1440 Chinook Ct SW
- 4395 Sirrocco Ln SW
- 1460 Chinook Ct SW
- 1445 Chinook Ct SW
- 1489 Oleander Dr SW
- 4390 Sirrocco Ln SW
- 0 Chinook Ct SW Unit 7265373
- 1455 Chinook Ct SW
- 4405 Sirrocco Ln SW
- 1477 Oleander Dr SW
- 1491 Oleander Dr SW
- 1480 Chinook Ct SW
- 1465 Chinook Ct SW
- 4400 Sirrocco Ln SW
- 1475 Chinook Ct SW
- 4425 Sirrocco Ln SW
- 4410 Sirrocco Ln SW
- 1467 Oleander Dr SW
- 4380 Fallowfield Ln SW
- 4370 Fallowfield Ln SW