Estimated Value: $602,000 - $665,000
3
Beds
3
Baths
2,687
Sq Ft
$237/Sq Ft
Est. Value
About This Home
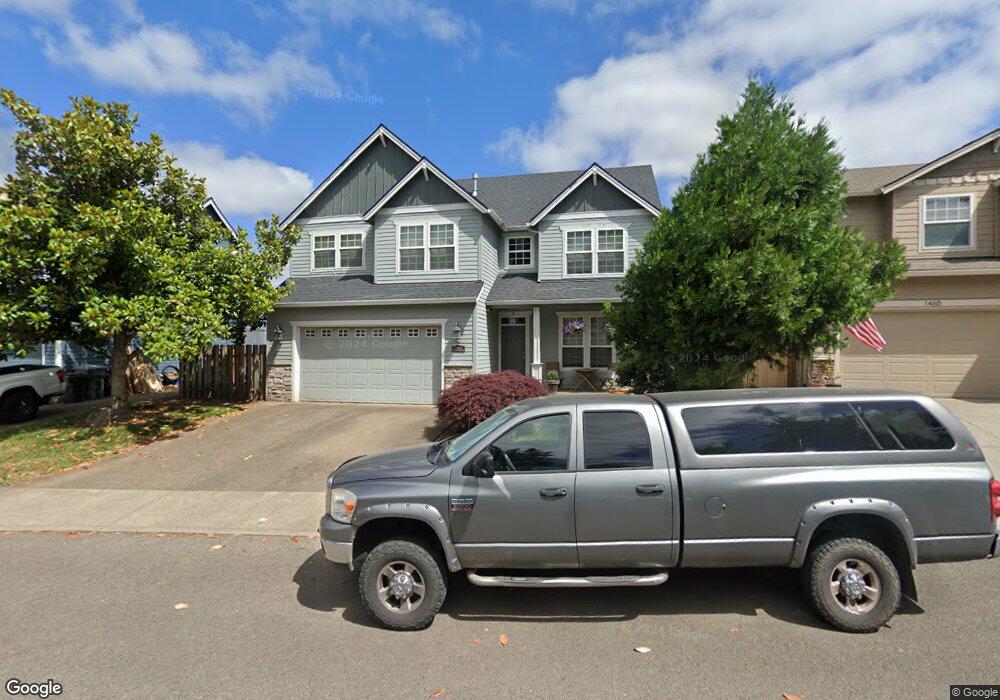
This home is located at 1450 SE 9th Ave, Canby, OR 97013 and is currently estimated at $636,513, approximately $236 per square foot. 1450 SE 9th Ave is a home located in Clackamas County with nearby schools including Josefa L. Sambrano Elementary School, Cecile Trost Elementary School, and Carus School.
Ownership History
Date
Name
Owned For
Owner Type
Purchase Details
Closed on
Jul 1, 2011
Sold by
Gonzalez Tony and Gonzalez Susan
Bought by
Stormo Paul M and Marshall Andrea L
Current Estimated Value
Purchase Details
Closed on
Oct 26, 2005
Sold by
Pollack Morgan S and Pollack Kris
Bought by
Gonzalez Tony and Gonzalez Susan
Home Financials for this Owner
Home Financials are based on the most recent Mortgage that was taken out on this home.
Original Mortgage
$319,000
Interest Rate
5.12%
Mortgage Type
Fannie Mae Freddie Mac
Purchase Details
Closed on
Nov 20, 2003
Sold by
Pollack Morgan S and Babler Thomas G
Bought by
Pollack Morgan S and Pollack Kris
Purchase Details
Closed on
Jan 29, 2002
Sold by
G Cam Ltd
Bought by
Pollack Morgan S and Babler Thomas G
Home Financials for this Owner
Home Financials are based on the most recent Mortgage that was taken out on this home.
Original Mortgage
$200,850
Interest Rate
5.89%
Create a Home Valuation Report for This Property
The Home Valuation Report is an in-depth analysis detailing your home's value as well as a comparison with similar homes in the area
Home Values in the Area
Average Home Value in this Area
Purchase History
| Date | Buyer | Sale Price | Title Company |
|---|---|---|---|
| Stormo Paul M | $255,000 | Chicago Title Insurance Co | |
| Gonzalez Tony | $355,000 | Chicago Title Insurance Co | |
| Pollack Morgan S | -- | -- | |
| Pollack Morgan S | $251,104 | Chicago Title |
Source: Public Records
Mortgage History
| Date | Status | Borrower | Loan Amount |
|---|---|---|---|
| Previous Owner | Gonzalez Tony | $319,000 | |
| Previous Owner | Pollack Morgan S | $200,850 |
Source: Public Records
Tax History Compared to Growth
Tax History
| Year | Tax Paid | Tax Assessment Tax Assessment Total Assessment is a certain percentage of the fair market value that is determined by local assessors to be the total taxable value of land and additions on the property. | Land | Improvement |
|---|---|---|---|---|
| 2025 | $6,149 | $347,064 | -- | -- |
| 2024 | $5,976 | $336,956 | -- | -- |
| 2023 | $5,976 | $327,142 | $0 | $0 |
| 2022 | $5,497 | $317,614 | $0 | $0 |
| 2021 | $5,293 | $308,364 | $0 | $0 |
| 2020 | $5,199 | $299,383 | $0 | $0 |
| 2019 | $4,951 | $290,664 | $0 | $0 |
| 2018 | $4,840 | $282,198 | $0 | $0 |
| 2017 | $4,717 | $273,979 | $0 | $0 |
| 2016 | $4,560 | $265,999 | $0 | $0 |
| 2015 | $4,404 | $258,251 | $0 | $0 |
| 2014 | $4,277 | $250,729 | $0 | $0 |
Source: Public Records
Map
Nearby Homes
- 1460 SE 9th Ave
- 575 S Ponderosa St
- 1053 S Vine St
- 423 SE 7th Ave
- 582 S Maple St
- 387 SE 7th Ave
- 331 SE 9th Ave
- 1143 SE 17th Ave
- 1357 SE 17th Ave
- 1333 SE 14th Ave
- 2180 SE 11th Place
- 1409 S Maple St
- 1072 S Walnut St
- 550 SE 5th Ave
- 385 SE Township Rd
- 1111 SE 3rd Ave Unit 74
- 1650 S Redwood St
- 2211 SE 12th Ave
- 1660 S Redwood St
- 1827 S Pepperwood St
- 1480 SE 9th Ave
- 1430 SE 9th Ave
- 861 S Redwood St
- 1441 SE 8th Ave
- 1470 SE 9th Ave
- 881 S Redwood St
- 1410 SE 9th Ave
- 1423 SE 8th Ave
- 853 S Redwood St
- 1451 SE 9th Ave
- 1429 SE 9th Ave
- 1459 SE 8th Ave
- 1380 SE 9th Ave
- 1473 SE 9th Ave
- 1405 SE 8th Ave
- 1381 SE 8th Ave
- 1405 SE 9th Ave
- 1487 SE 9th Ave
- 1477 SE 8th Ave
- 1391 SE 8th Ave