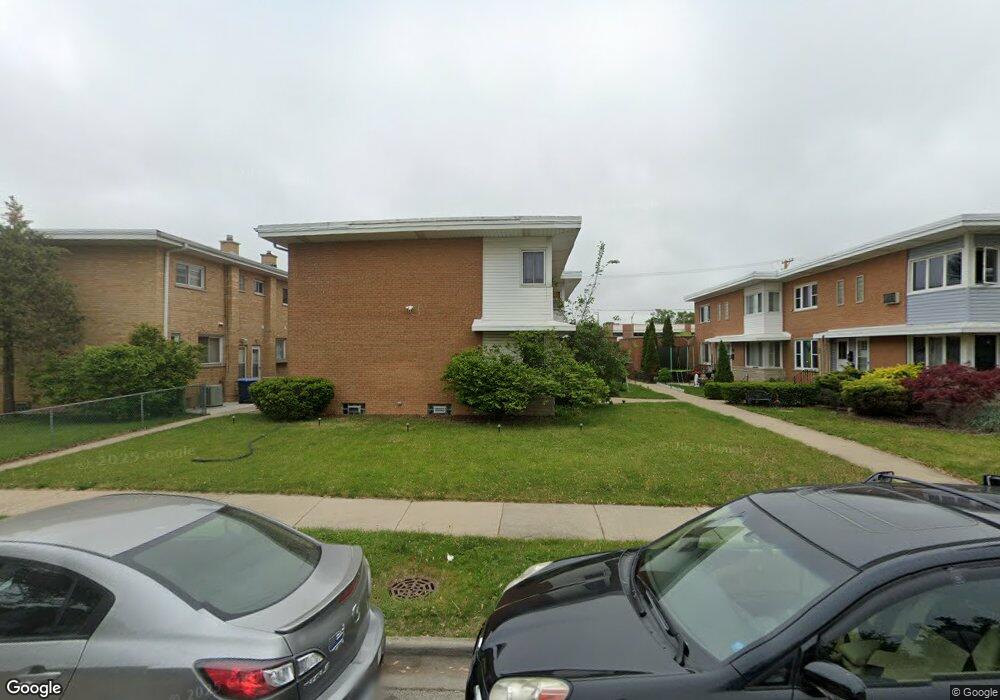
1450 Willow Ave Des Plaines, IL 60016
Estimated Value: $243,000 - $283,000
2
Beds
2
Baths
1,140
Sq Ft
$234/Sq Ft
Est. Value
About This Home
This home is located at 1450 Willow Ave, Des Plaines, IL 60016 and is currently estimated at $266,355, approximately $233 per square foot. 1450 Willow Ave is a home located in Cook County with nearby schools including North Elementary School, Chippewa Middle School, and Maine West High School.
Ownership History
Date
Name
Owned For
Owner Type
Purchase Details
Closed on
Jul 12, 2022
Sold by
Martinez Antonio and Martinez Nubia
Bought by
Cervantes Jaime Esquivel and Mejia Flor
Current Estimated Value
Home Financials for this Owner
Home Financials are based on the most recent Mortgage that was taken out on this home.
Original Mortgage
$219,942
Outstanding Balance
$209,065
Interest Rate
5.63%
Mortgage Type
FHA
Estimated Equity
$57,290
Purchase Details
Closed on
Aug 27, 2010
Sold by
North Shore Holdings Ltd
Bought by
Martinez Antonio and Montesinos Nubia
Home Financials for this Owner
Home Financials are based on the most recent Mortgage that was taken out on this home.
Original Mortgage
$114,750
Interest Rate
4.49%
Mortgage Type
New Conventional
Purchase Details
Closed on
Jul 22, 2004
Sold by
Aldous Marilyne
Bought by
Vega Rogelio and Vega Ramona
Home Financials for this Owner
Home Financials are based on the most recent Mortgage that was taken out on this home.
Original Mortgage
$146,700
Interest Rate
8.96%
Mortgage Type
Fannie Mae Freddie Mac
Purchase Details
Closed on
Aug 19, 1994
Sold by
Mcgowan Martin and Mcgowan Marian
Bought by
Grayson Michael R and Grayson Stephen D
Home Financials for this Owner
Home Financials are based on the most recent Mortgage that was taken out on this home.
Original Mortgage
$103,681
Interest Rate
8.72%
Mortgage Type
FHA
Create a Home Valuation Report for This Property
The Home Valuation Report is an in-depth analysis detailing your home's value as well as a comparison with similar homes in the area
Home Values in the Area
Average Home Value in this Area
Purchase History
| Date | Buyer | Sale Price | Title Company |
|---|---|---|---|
| Cervantes Jaime Esquivel | $224,000 | None Listed On Document | |
| Martinez Antonio | $138,000 | Cti | |
| Vega Rogelio | $163,000 | Git | |
| Grayson Michael R | $106,800 | -- |
Source: Public Records
Mortgage History
| Date | Status | Borrower | Loan Amount |
|---|---|---|---|
| Open | Cervantes Jaime Esquivel | $219,942 | |
| Previous Owner | Martinez Antonio | $114,750 | |
| Previous Owner | Vega Rogelio | $146,700 | |
| Previous Owner | Grayson Michael R | $103,681 |
Source: Public Records
Tax History
| Year | Tax Paid | Tax Assessment Tax Assessment Total Assessment is a certain percentage of the fair market value that is determined by local assessors to be the total taxable value of land and additions on the property. | Land | Improvement |
|---|---|---|---|---|
| 2025 | $5,536 | $21,000 | $5,248 | $15,752 |
| 2024 | $5,536 | $21,000 | $3,000 | $18,000 |
| 2023 | $4,523 | $21,000 | $3,000 | $18,000 |
| 2022 | $4,523 | $21,000 | $3,000 | $18,000 |
| 2021 | $2,713 | $12,156 | $897 | $11,259 |
| 2020 | $2,736 | $12,156 | $897 | $11,259 |
| 2019 | $2,712 | $13,507 | $897 | $12,610 |
| 2018 | $2,841 | $12,935 | $794 | $12,141 |
| 2017 | $2,809 | $12,935 | $794 | $12,141 |
| 2016 | $2,900 | $12,935 | $794 | $12,141 |
| 2015 | $3,985 | $13,181 | $690 | $12,491 |
| 2014 | $3,901 | $13,181 | $690 | $12,491 |
| 2013 | $3,804 | $13,181 | $690 | $12,491 |
Source: Public Records
Map
Nearby Homes
- 365 Graceland Ave Unit 205A
- 1333 Willow Ave
- 430 Oak St
- 1349 E Washington St Unit 404A
- 194 Grove Ave Unit A
- 1378 Perry St Unit 412
- 1330 Perry St Unit 504
- 1258 Brown St Unit 302
- 182 Eli Ct
- 182 Lilah Ct
- 183 Eli Ct
- 185 Eli Ct
- 184 Lilah Ct
- 1325 Perry St Unit 606
- 545 S River Rd Unit 307A
- 1160 Evergreen Ave
- 430 S Western Ave Unit 601
- 390 S Western Ave Unit 706
- 603 S River Rd Unit 2M
- 650 S River Rd Unit 801
- 1452 Willow Ave
- 1448 Willow Ave
- 1446 Willow Ave
- 1454 Willow Ave
- 1456 Willow Ave
- 1456 Willow Ave Unit 1456
- 1440 Willow Ave
- 1458 Willow Ave
- 1438 Willow Ave
- 1444 Willow Ave
- 1460 Willow Ave
- 1449 Rand Rd Unit 1
- 1449 Rand Rd Unit 2
- 1449 Rand Rd
- 1449 Rand Rd Unit 3
- 1436 Willow Ave
- 1434 Willow Ave
- 1462 Willow Ave
- 1464 Willow Ave
- 1468 Willow Ave
Your Personal Tour Guide
Ask me questions while you tour the home.