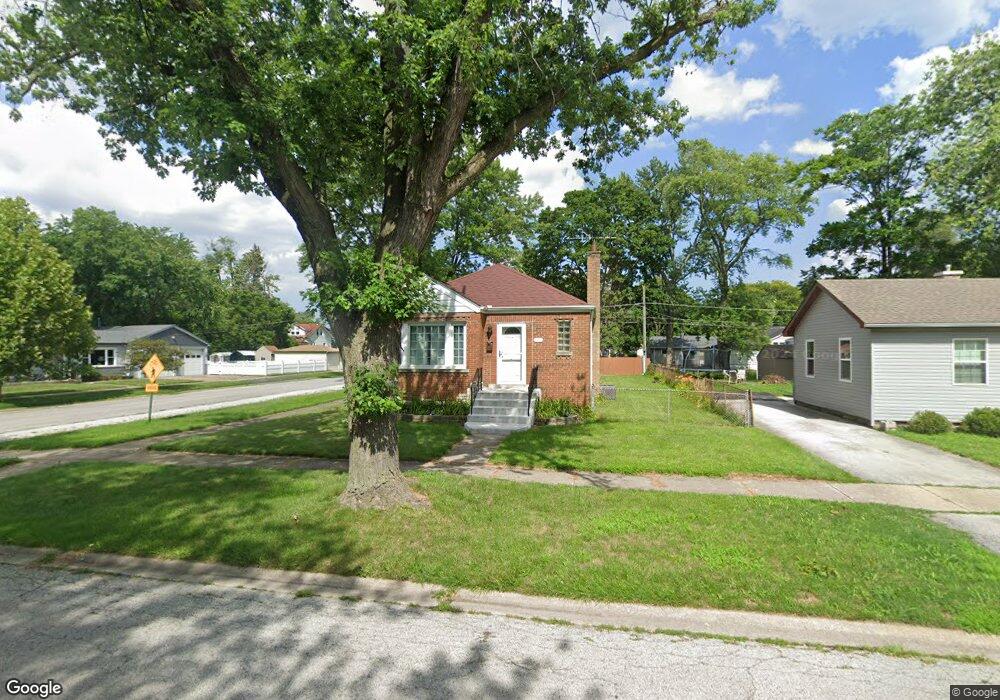
14501 Trumbull Ave Midlothian, IL 60445
Estimated Value: $217,000 - $230,000
3
Beds
1
Bath
1,113
Sq Ft
$202/Sq Ft
Est. Value
About This Home
This home is located at 14501 Trumbull Ave, Midlothian, IL 60445 and is currently estimated at $224,339, approximately $201 per square foot. 14501 Trumbull Ave is a home located in Cook County with nearby schools including Springfield Elementary School, Bremen High School, and St. Christopher School.
Ownership History
Date
Name
Owned For
Owner Type
Purchase Details
Closed on
Jul 13, 2005
Sold by
Raithel Brad and Raithel Rebecca
Bought by
Wolfe Michael A
Current Estimated Value
Home Financials for this Owner
Home Financials are based on the most recent Mortgage that was taken out on this home.
Original Mortgage
$179,900
Outstanding Balance
$92,414
Interest Rate
5.71%
Mortgage Type
Fannie Mae Freddie Mac
Estimated Equity
$131,925
Purchase Details
Closed on
Apr 27, 2001
Sold by
First Midwest Trust Company Natl Assn
Bought by
Raithel Brad and Raithel Becky
Home Financials for this Owner
Home Financials are based on the most recent Mortgage that was taken out on this home.
Original Mortgage
$85,260
Interest Rate
7.23%
Mortgage Type
FHA
Create a Home Valuation Report for This Property
The Home Valuation Report is an in-depth analysis detailing your home's value as well as a comparison with similar homes in the area
Home Values in the Area
Average Home Value in this Area
Purchase History
| Date | Buyer | Sale Price | Title Company |
|---|---|---|---|
| Wolfe Michael A | $180,000 | Multiple | |
| Raithel Brad | $95,000 | Stewart Title Company |
Source: Public Records
Mortgage History
| Date | Status | Borrower | Loan Amount |
|---|---|---|---|
| Open | Wolfe Michael A | $179,900 | |
| Previous Owner | Raithel Brad | $85,260 |
Source: Public Records
Tax History
| Year | Tax Paid | Tax Assessment Tax Assessment Total Assessment is a certain percentage of the fair market value that is determined by local assessors to be the total taxable value of land and additions on the property. | Land | Improvement |
|---|---|---|---|---|
| 2025 | $5,179 | $17,000 | $2,374 | $14,626 |
| 2024 | $5,179 | $17,000 | $2,374 | $14,626 |
| 2023 | $4,303 | $17,000 | $2,374 | $14,626 |
| 2022 | $4,303 | $12,579 | $2,035 | $10,544 |
| 2021 | $4,177 | $12,578 | $2,034 | $10,544 |
| 2020 | $4,076 | $12,578 | $2,034 | $10,544 |
| 2019 | $4,196 | $13,090 | $1,865 | $11,225 |
| 2018 | $4,127 | $13,090 | $1,865 | $11,225 |
| 2017 | $4,002 | $13,090 | $1,865 | $11,225 |
| 2016 | $3,858 | $11,489 | $1,695 | $9,794 |
| 2015 | $3,719 | $11,489 | $1,695 | $9,794 |
| 2014 | $3,632 | $11,489 | $1,695 | $9,794 |
| 2013 | $3,731 | $12,828 | $1,695 | $11,133 |
Source: Public Records
Map
Nearby Homes
- 14503 Waverly Ave
- 3625 147th St
- 3206 Kinne Rd
- 3642 147th Place
- 3618 148th St
- 14328 Lawndale Ave
- 14832 Clifton Park Ave
- 14301 Hamlin Ave
- 14044 S Grace Ave
- 3127 141st Place
- 3131 141st Place
- 14039 S Claire Blvd
- 2918 143rd Place
- 2808 W 140th Place
- 14544 S San Francisco Ave
- 3902 Claire Blvd
- 14539 Crawford Ave
- 3747 W 140th Place
- 2829 W 140th St
- 14925 Whipple Ave
- 14507 Trumbull Ave
- 14513 Trumbull Ave
- 14457 Trumbull Ave
- 14502 Homan Ave
- 14506 Homan Ave
- 14517 Trumbull Ave
- 14510 Homan Ave
- 14451 Trumbull Ave
- 14458 Homan Ave
- 14500 Trumbull Ave
- 14521 Trumbull Ave
- 14516 Homan Ave
- 14506 Trumbull Ave
- 14450 Homan Ave
- 14447 Trumbull Ave
- 14510 Trumbull Ave
- 14456 Trumbull Ave
- 14522 Homan Ave
- 14516 Trumbull Ave
- 14527 Trumbull Ave
Your Personal Tour Guide
Ask me questions while you tour the home.