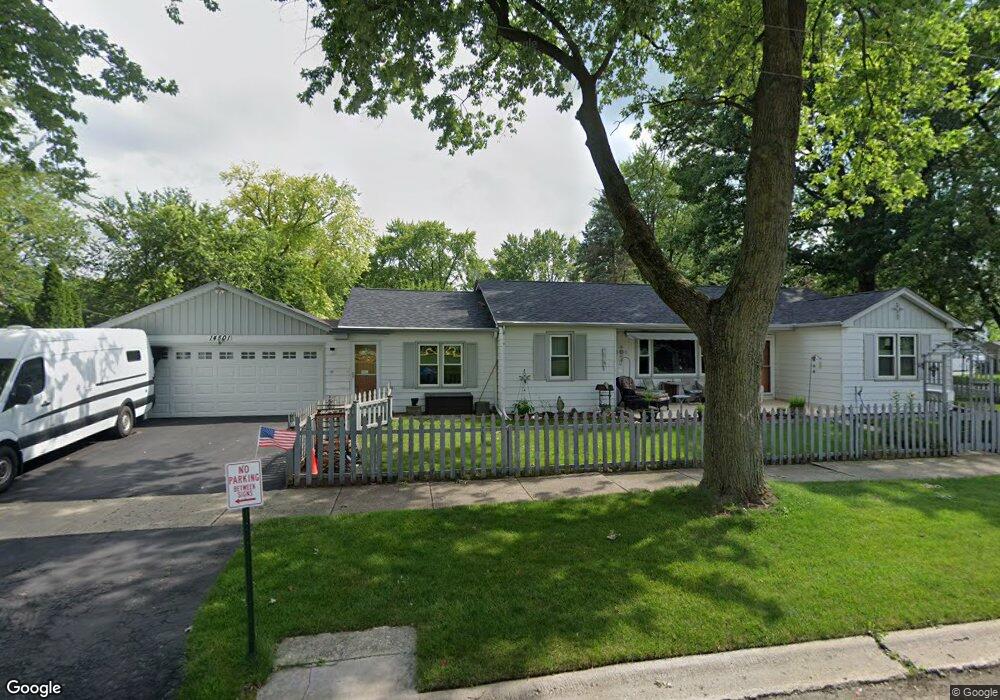
14501 Turner Ave Midlothian, IL 60445
Estimated Value: $206,000 - $238,000
4
Beds
1
Bath
1,629
Sq Ft
$136/Sq Ft
Est. Value
About This Home
This home is located at 14501 Turner Ave, Midlothian, IL 60445 and is currently estimated at $221,116, approximately $135 per square foot. 14501 Turner Ave is a home located in Cook County with nearby schools including Springfield Elementary School, Bremen High School, and St Christopher School.
Ownership History
Date
Name
Owned For
Owner Type
Purchase Details
Closed on
May 15, 2013
Sold by
Cimaroli Karl J and Cimaroli Rose
Bought by
Cimaroli Karl J and Cimaroli Rose
Current Estimated Value
Home Financials for this Owner
Home Financials are based on the most recent Mortgage that was taken out on this home.
Original Mortgage
$83,000
Outstanding Balance
$15,896
Interest Rate
2.87%
Mortgage Type
New Conventional
Estimated Equity
$205,220
Purchase Details
Closed on
Jun 11, 2001
Sold by
Clark Dale E and Clark Charlene
Bought by
Cimaroli Karl J
Home Financials for this Owner
Home Financials are based on the most recent Mortgage that was taken out on this home.
Original Mortgage
$108,120
Interest Rate
7.27%
Mortgage Type
VA
Purchase Details
Closed on
Jul 15, 1998
Sold by
Charleston Donald A and Charleston Ann K
Bought by
Clark Dale E and Clark Charlene
Home Financials for this Owner
Home Financials are based on the most recent Mortgage that was taken out on this home.
Original Mortgage
$98,569
Interest Rate
7.13%
Create a Home Valuation Report for This Property
The Home Valuation Report is an in-depth analysis detailing your home's value as well as a comparison with similar homes in the area
Home Values in the Area
Average Home Value in this Area
Purchase History
| Date | Buyer | Sale Price | Title Company |
|---|---|---|---|
| Cimaroli Karl J | -- | None Available | |
| Cimaroli Karl J | $106,000 | Ticor Title | |
| Clark Dale E | -- | Intercounty Title |
Source: Public Records
Mortgage History
| Date | Status | Borrower | Loan Amount |
|---|---|---|---|
| Open | Cimaroli Karl J | $83,000 | |
| Closed | Cimaroli Karl J | $108,120 | |
| Previous Owner | Clark Dale E | $98,569 |
Source: Public Records
Tax History
| Year | Tax Paid | Tax Assessment Tax Assessment Total Assessment is a certain percentage of the fair market value that is determined by local assessors to be the total taxable value of land and additions on the property. | Land | Improvement |
|---|---|---|---|---|
| 2025 | $4,930 | $18,000 | $2,375 | $15,625 |
| 2024 | $4,930 | $18,000 | $2,375 | $15,625 |
| 2023 | $3,393 | $18,000 | $2,375 | $15,625 |
| 2022 | $3,393 | $12,353 | $2,036 | $10,317 |
| 2021 | $3,322 | $12,351 | $2,035 | $10,316 |
| 2020 | $3,712 | $12,351 | $2,035 | $10,316 |
| 2019 | $3,962 | $13,238 | $1,865 | $11,373 |
| 2018 | $3,897 | $13,238 | $1,865 | $11,373 |
| 2017 | $3,785 | $13,238 | $1,865 | $11,373 |
| 2016 | $3,688 | $11,806 | $1,696 | $10,110 |
| 2015 | $3,538 | $11,806 | $1,696 | $10,110 |
| 2014 | $3,462 | $11,806 | $1,696 | $10,110 |
| 2013 | $3,700 | $12,745 | $1,696 | $11,049 |
Source: Public Records
Map
Nearby Homes
- 14503 Waverly Ave
- 3625 147th St
- 3206 Kinne Rd
- 3642 147th Place
- 3618 148th St
- 14832 Clifton Park Ave
- 14328 Lawndale Ave
- 14301 Hamlin Ave
- 2918 143rd Place
- 3127 141st Place
- 3131 141st Place
- 14544 S San Francisco Ave
- 14044 S Grace Ave
- 14925 Whipple Ave
- 14039 S Claire Blvd
- 14828 S San Francisco Ave
- 2808 W 140th Place
- 2900 141st Place
- 3902 Claire Blvd
- 2829 W 140th St
- 14507 Turner Ave
- 14511 Turner Ave
- 14500 Spaulding Ave
- 14506 Spaulding Ave
- 14519 Turner Ave
- 14510 Spaulding Ave
- 14500 Turner Ave
- 14516 Spaulding Ave
- 14521 Turner Ave
- 14506 Turner Ave
- 14512 Turner Ave
- 14522 Spaulding Ave
- 14529 Turner Ave
- 14522 Turner Ave
- 14528 Spaulding Ave
- 14533 Turner Ave
- 14526 Turner Ave
- 14532 Spaulding Ave
- 14501 Spaulding Ave
- 14501 Homan Ave
Your Personal Tour Guide
Ask me questions while you tour the home.