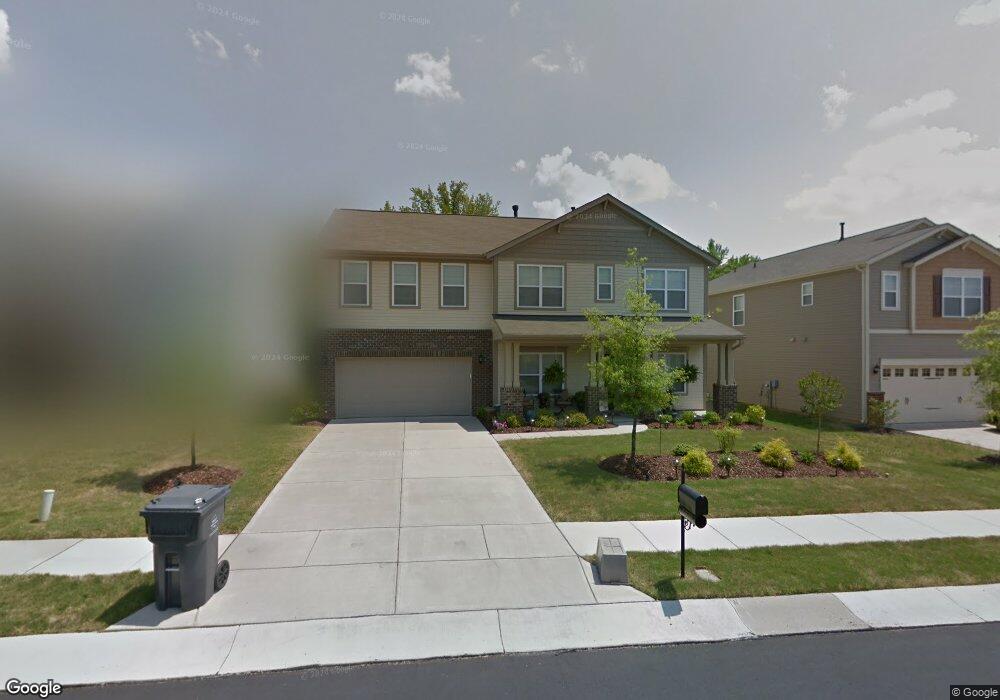
14509 Glenduff Place Unit 209 Charlotte, NC 28278
The Palisades NeighborhoodEstimated Value: $464,000 - $487,274
5
Beds
3
Baths
3,262
Sq Ft
$145/Sq Ft
Est. Value
About This Home
This home is located at 14509 Glenduff Place Unit 209, Charlotte, NC 28278 and is currently estimated at $472,819, approximately $144 per square foot. 14509 Glenduff Place Unit 209 is a home located in Mecklenburg County with nearby schools including River Gate Elementary, Southwest Middle School, and Unity Classical Charter School.
Ownership History
Date
Name
Owned For
Owner Type
Purchase Details
Closed on
Oct 10, 2024
Sold by
Aino Nc Llc
Bought by
Chandrashekar Santosh
Current Estimated Value
Home Financials for this Owner
Home Financials are based on the most recent Mortgage that was taken out on this home.
Original Mortgage
$374,400
Outstanding Balance
$370,464
Interest Rate
6.35%
Mortgage Type
New Conventional
Estimated Equity
$102,355
Purchase Details
Closed on
Apr 5, 2018
Sold by
Thrower Raymond Hugh and Thrower Valerie Willis
Bought by
Aino Nc Llc
Purchase Details
Closed on
Sep 11, 2013
Sold by
M I Homes Of Charlotte Llc
Bought by
Thrower Raymond Hugh and Thrower Valerie Willis
Home Financials for this Owner
Home Financials are based on the most recent Mortgage that was taken out on this home.
Original Mortgage
$150,000
Interest Rate
4.37%
Mortgage Type
New Conventional
Create a Home Valuation Report for This Property
The Home Valuation Report is an in-depth analysis detailing your home's value as well as a comparison with similar homes in the area
Home Values in the Area
Average Home Value in this Area
Purchase History
| Date | Buyer | Sale Price | Title Company |
|---|---|---|---|
| Chandrashekar Santosh | $468,000 | None Listed On Document | |
| Aino Nc Llc | $279,000 | None Available | |
| Thrower Raymond Hugh | $237,500 | None Available |
Source: Public Records
Mortgage History
| Date | Status | Borrower | Loan Amount |
|---|---|---|---|
| Open | Chandrashekar Santosh | $374,400 | |
| Previous Owner | Thrower Raymond Hugh | $150,000 |
Source: Public Records
Tax History Compared to Growth
Tax History
| Year | Tax Paid | Tax Assessment Tax Assessment Total Assessment is a certain percentage of the fair market value that is determined by local assessors to be the total taxable value of land and additions on the property. | Land | Improvement |
|---|---|---|---|---|
| 2025 | $3,176 | $454,600 | $90,000 | $364,600 |
| 2024 | $3,176 | $454,600 | $90,000 | $364,600 |
| 2023 | $3,125 | $454,600 | $90,000 | $364,600 |
| 2022 | $2,947 | $324,300 | $40,000 | $284,300 |
| 2021 | $2,877 | $324,300 | $40,000 | $284,300 |
| 2020 | $2,861 | $324,300 | $40,000 | $284,300 |
| 2019 | $2,828 | $324,300 | $40,000 | $284,300 |
| 2018 | $2,258 | $199,500 | $38,300 | $161,200 |
| 2017 | $2,239 | $199,500 | $38,300 | $161,200 |
| 2016 | $2,209 | $199,500 | $38,300 | $161,200 |
| 2015 | $2,186 | $199,500 | $38,300 | $161,200 |
| 2014 | $2,148 | $38,300 | $38,300 | $0 |
Source: Public Records
Map
Nearby Homes
- 15105 Cavanshire Trail
- 14909 Brannock Hills Dr
- 15030 Brannock Hills Dr
- 1385 Rainier Dr
- 660 Brookhaven Dr
- 1326 Crown Ridge Dr
- 12809 Hunting Birds Ln
- 14727 Brannock Hills Dr
- 3199 Windhaven Ln
- 4069 Havenport Cir
- 12724 Hunting Birds Ln
- 1212 Croft Dr
- 1206 E Croft Dr
- 15307 Autumn Sage Dr
- 1700 Zoar Rd
- 15133 Torrence Branch Rd
- 3260 Highway 160 W
- 804 Gable Oak Ln
- 808 Gable Oak Ln
- 16001 Arabian Mews Ln
- 14509 Glenduff Place
- 14513 Glenduff Place
- 14505 Glenduff Place
- 14517 Glenduff Place
- 14501 Glenduff Place
- 14512 Glenduff Place
- 14521 Glenduff Place
- 14508 Glenduff Place Unit 224
- 14419 Glenduff Place
- 14500 Glenduff Place
- 14504 Glenduff Place
- 14516 Glenduff Place
- 14520 Glenduff Place
- 14525 Glenduff Place
- 14420 Glenduff Place
- 14415 Glenduff Place
- 14601 Glenduff Place
- 14416 Glenduff Place
- 14524 Glenduff Place
- 14323 Lunenberg Ln