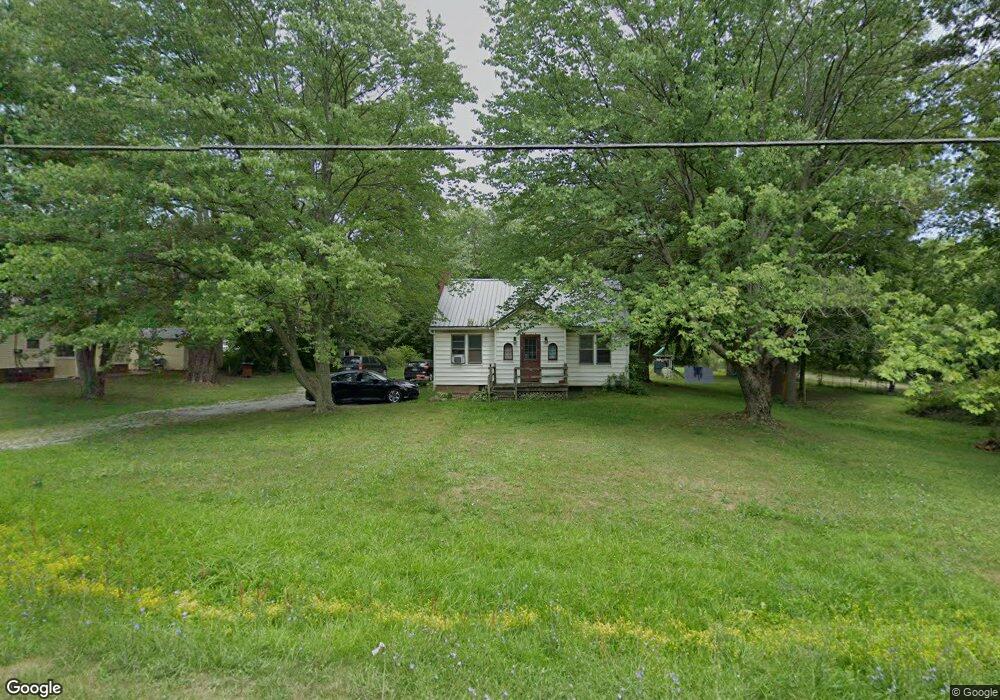
1451 Beeson St NE Alliance, OH 44601
Estimated Value: $142,000 - $230,000
3
Beds
1
Bath
1,304
Sq Ft
$134/Sq Ft
Est. Value
About This Home
This home is located at 1451 Beeson St NE, Alliance, OH 44601 and is currently estimated at $175,154, approximately $134 per square foot. 1451 Beeson St NE is a home located in Stark County with nearby schools including Marlington High School and Regina Coeli/St Joseph School.
Ownership History
Date
Name
Owned For
Owner Type
Purchase Details
Closed on
Dec 4, 2009
Sold by
Barone Richard J and Barone Patricia L
Bought by
Barone Richard J and Barone Patricia L
Current Estimated Value
Purchase Details
Closed on
Sep 9, 2009
Sold by
The Bank Of New York Trust Company Na
Bought by
Barone Richard J
Purchase Details
Closed on
Jun 28, 2000
Sold by
Thompson Roger
Bought by
Cottrell Jeffrey S and Cottrell Lana D
Home Financials for this Owner
Home Financials are based on the most recent Mortgage that was taken out on this home.
Original Mortgage
$51,500
Interest Rate
8.66%
Mortgage Type
FHA
Purchase Details
Closed on
Jun 8, 2000
Sold by
Last Will Of Sams Betty J and Naomi
Bought by
Thompson Roger
Home Financials for this Owner
Home Financials are based on the most recent Mortgage that was taken out on this home.
Original Mortgage
$51,500
Interest Rate
8.66%
Mortgage Type
FHA
Create a Home Valuation Report for This Property
The Home Valuation Report is an in-depth analysis detailing your home's value as well as a comparison with similar homes in the area
Home Values in the Area
Average Home Value in this Area
Purchase History
| Date | Buyer | Sale Price | Title Company |
|---|---|---|---|
| Barone Richard J | -- | Attorney | |
| Barone Richard J | $27,100 | Landcastle Title Llc | |
| Cottrell Jeffrey S | $52,000 | Union Title Company | |
| Thompson Roger | $45,000 | Union Title Company |
Source: Public Records
Mortgage History
| Date | Status | Borrower | Loan Amount |
|---|---|---|---|
| Previous Owner | Cottrell Jeffrey S | $51,500 | |
| Closed | Cottrell Jeffrey S | $1,600 |
Source: Public Records
Tax History Compared to Growth
Tax History
| Year | Tax Paid | Tax Assessment Tax Assessment Total Assessment is a certain percentage of the fair market value that is determined by local assessors to be the total taxable value of land and additions on the property. | Land | Improvement |
|---|---|---|---|---|
| 2025 | -- | $55,660 | $32,730 | $22,930 |
| 2024 | -- | $55,660 | $32,730 | $22,930 |
| 2023 | $1,366 | $37,910 | $23,030 | $14,880 |
| 2022 | $686 | $37,910 | $23,030 | $14,880 |
| 2021 | $1,376 | $37,910 | $23,030 | $14,880 |
| 2020 | $1,331 | $32,700 | $19,850 | $12,850 |
| 2019 | $1,323 | $32,700 | $19,850 | $12,850 |
| 2018 | $1,294 | $32,700 | $19,850 | $12,850 |
| 2017 | $1,023 | $24,190 | $13,160 | $11,030 |
| 2016 | $1,023 | $24,190 | $13,160 | $11,030 |
| 2015 | $974 | $24,190 | $13,160 | $11,030 |
| 2014 | $1,083 | $24,570 | $13,370 | $11,200 |
| 2013 | $539 | $24,570 | $13,370 | $11,200 |
Source: Public Records
Map
Nearby Homes
- 432 Johnson Ave
- 000 Klinger Ave
- 0 W Main St Unit 5090123
- 565 W Broadway St
- 000 Meadowbrook Ave
- 520 W Cambridge St
- 345 W Market St
- 0 Meadowbrook Ave
- 329 1/2 W Main St
- 725 W Summit St
- 734 Parkway Blvd
- 13334 Cindy St NE
- 0 Klinger Ave NE
- 0 Meadow St NE
- 645 W Summit St
- 0 Homestead Ave NE
- 1038 Fairview Place
- 896 Parkway Blvd
- 0 Johnson Ave NE Unit 5142926
- 970 Kingsway St
- 1491 Beeson St NE
- 1497 Beeson St NE
- 249 Smyth Ave
- 1401 Beeson St NE
- 225 Smyth Ave
- 205 Smyth Ave
- 1385 Beeson St NE
- 1374 Beeson St NE
- 1374 Beeson St NE
- 1368 Beeson St NE
- 1355 Beeson St NE
- 309 Smyth Ave
- 1415 Beeson St NE
- 1345 Beeson St NE
- 331 Smyth Ave
- 1342 Beeson St NE
- 1325 Beeson St NE
- 351 Smyth Ave
- 1334 Beeson St NE
- 236 Klinger Ave