Estimated Value: $264,490 - $313,000
4
Beds
1
Bath
2,544
Sq Ft
$114/Sq Ft
Est. Value
About This Home
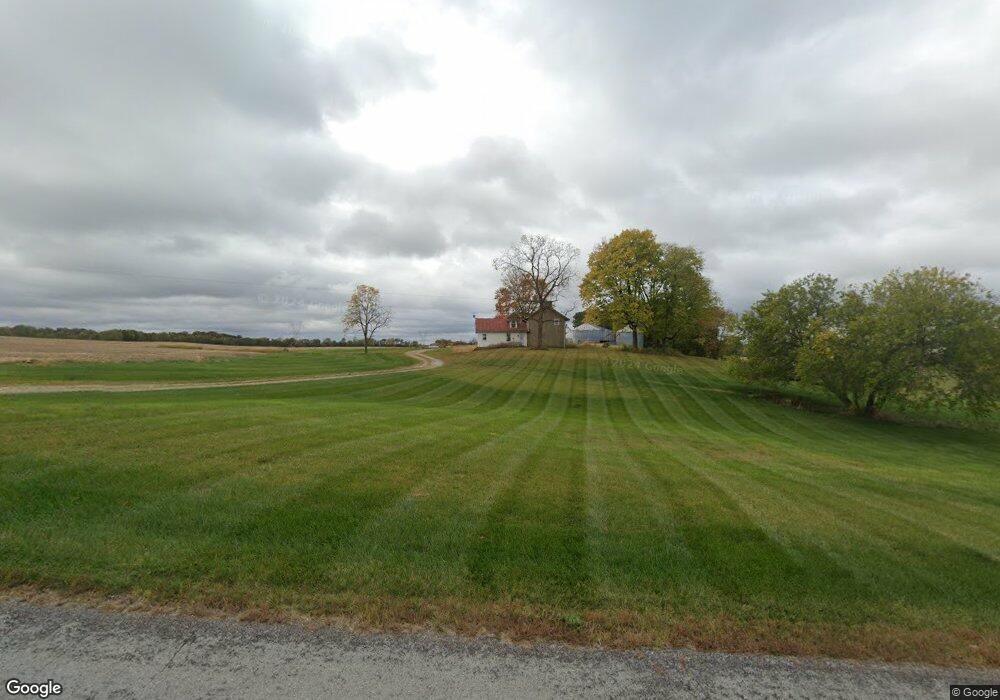
This home is located at 1451 Bradfute Rd, Xenia, OH 45385 and is currently estimated at $288,745, approximately $113 per square foot. 1451 Bradfute Rd is a home located in Greene County with nearby schools including Cedarville Elementary School and Cedarville High School.
Ownership History
Date
Name
Owned For
Owner Type
Purchase Details
Closed on
Aug 2, 2023
Sold by
Fife Terry J and Fife Mckim N
Bought by
Stone House Sisters Llc
Current Estimated Value
Purchase Details
Closed on
May 10, 2022
Sold by
Brent Krajicek
Bought by
Fife Terry J and Fife Linda J
Purchase Details
Closed on
Nov 20, 2019
Sold by
Thompson R Alan R and Thompson Theresa L
Bought by
Krajicek James J and Krajicek Deborah A
Purchase Details
Closed on
Dec 8, 2018
Sold by
Cook Terri Thornhill
Bought by
Thompson R Alan and Thompson Theresa L
Purchase Details
Closed on
Jan 18, 2018
Sold by
Thompson R Alan and Thompson Theresa L
Bought by
Cook Terri Thomhill
Purchase Details
Closed on
Dec 28, 2017
Sold by
Collins Phyllis R
Bought by
Thompson R Alan and Thompson Theresa L
Create a Home Valuation Report for This Property
The Home Valuation Report is an in-depth analysis detailing your home's value as well as a comparison with similar homes in the area
Home Values in the Area
Average Home Value in this Area
Purchase History
| Date | Buyer | Sale Price | Title Company |
|---|---|---|---|
| Stone House Sisters Llc | -- | None Listed On Document | |
| Fife Terry J | $210,000 | Stephan & Stephan Law Group Ll | |
| Krajicek James J | $110,000 | None Available | |
| Thompson R Alan | -- | None Available | |
| Cook Terri Thomhill | $1,197,200 | -- | |
| Thompson R Alan | $1,530,000 | -- |
Source: Public Records
Tax History Compared to Growth
Tax History
| Year | Tax Paid | Tax Assessment Tax Assessment Total Assessment is a certain percentage of the fair market value that is determined by local assessors to be the total taxable value of land and additions on the property. | Land | Improvement |
|---|---|---|---|---|
| 2024 | $5,559 | $91,460 | $29,900 | $61,560 |
| 2023 | $5,559 | $91,460 | $29,900 | $61,560 |
| 2022 | $3,036 | $72,810 | $25,630 | $47,180 |
| 2021 | $3,070 | $72,810 | $25,630 | $47,180 |
| 2020 | $3,058 | $72,810 | $25,630 | $47,180 |
| 2019 | $3,793 | $331,700 | $279,850 | $51,850 |
| 2018 | $8,322 | $331,710 | $279,850 | $51,860 |
| 2017 | $7,886 | $331,710 | $279,850 | $51,860 |
| 2016 | $9,208 | $301,960 | $252,490 | $49,470 |
| 2015 | $20,285 | $303,730 | $252,490 | $51,240 |
| 2014 | $14,679 | $311,340 | $252,490 | $58,850 |
Source: Public Records
Map
Nearby Homes
- 1315 Corry St
- 420 Spring Glen Dr
- 345 Stewart Dr
- 0 Mason Rd
- 1287 Brush Row Rd
- 1645 Randall Rd
- 2448 Sutton Rd
- 310 Allen St
- 2710 Sutton Rd
- 1302 Shawnee Dr
- 117 Allen St
- 0 Us 42 Unit 941174
- 517 Iris Dr
- 00 Xenia Ave
- 902 N Bickett Rd
- 117 E North College St
- 460 Kinsey Rd
- 750 W South College St
- 504 Phillips St
- 983 Echo Ct
- 1486 Bradfute Rd
- 1300 Bradfute Rd
- 1526 Bradfute Rd
- 1462 Bradfute Rd
- 2583 Wilberforce Clifton Rd
- 2631 Wilberforce Clifton Rd
- 2619 Wilberforce Clifton Rd
- 2661 Wilberforce Clifton Rd
- 2480 Wilberforce Clifton Rd
- 1071 Clifton Rd
- 1080 Bradfute Rd
- 1137 Clifton Rd
- 2490 Clark Run Rd
- 1.4 Acres Wilberforce Clifton Rd
- 2844 Grinnell Rd
- 2330 Clark Run Rd
- 2170 Wilberforce Clifton Rd
- 2555 Tarbox Cemetery Rd
- 2395 Clark Run Rd
- 1133 Clifton Rd