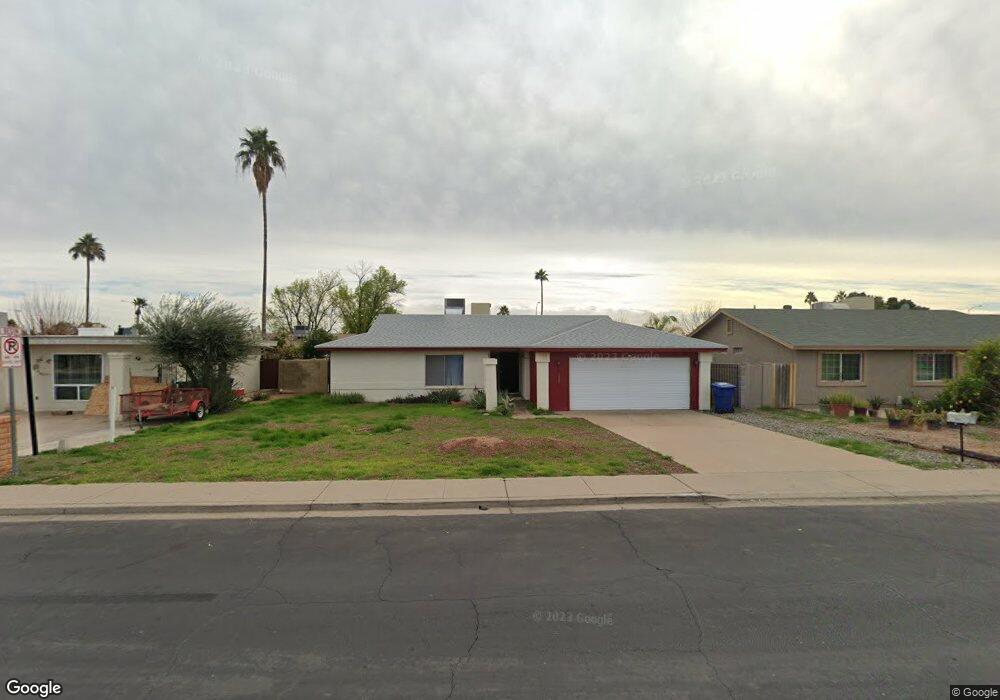
1451 E Emerald Ave Mesa, AZ 85204
Reed Park NeighborhoodEstimated Value: $331,134 - $429,000
3
Beds
2
Baths
1,235
Sq Ft
$319/Sq Ft
Est. Value
About This Home
This home is located at 1451 E Emerald Ave, Mesa, AZ 85204 and is currently estimated at $394,284, approximately $319 per square foot. 1451 E Emerald Ave is a home located in Maricopa County with nearby schools including Lindbergh Elementary School, Franklin at Brimhall Elementary School, and Franklin West Elementary School.
Ownership History
Date
Name
Owned For
Owner Type
Purchase Details
Closed on
May 24, 2000
Sold by
Johnson Natalie S
Bought by
Olson Sharon L
Current Estimated Value
Home Financials for this Owner
Home Financials are based on the most recent Mortgage that was taken out on this home.
Original Mortgage
$105,750
Outstanding Balance
$36,033
Interest Rate
7.95%
Mortgage Type
New Conventional
Estimated Equity
$358,251
Purchase Details
Closed on
Jun 10, 1999
Sold by
Thornton James and Thornton Joan C
Bought by
Johnson Natalie S
Home Financials for this Owner
Home Financials are based on the most recent Mortgage that was taken out on this home.
Original Mortgage
$86,400
Interest Rate
7.05%
Mortgage Type
New Conventional
Purchase Details
Closed on
Mar 4, 1994
Sold by
Goodenberger William D and Goodenberger Susan
Bought by
Thornton James and Thornton Joan C
Home Financials for this Owner
Home Financials are based on the most recent Mortgage that was taken out on this home.
Original Mortgage
$74,160
Interest Rate
7.67%
Mortgage Type
VA
Create a Home Valuation Report for This Property
The Home Valuation Report is an in-depth analysis detailing your home's value as well as a comparison with similar homes in the area
Home Values in the Area
Average Home Value in this Area
Purchase History
| Date | Buyer | Sale Price | Title Company |
|---|---|---|---|
| Olson Sharon L | $117,500 | Chicago Title Insurance Co | |
| Johnson Natalie S | $108,000 | Chicago Title Insurance Co | |
| Thornton James | $72,000 | Network Escrow & Title Agenc |
Source: Public Records
Mortgage History
| Date | Status | Borrower | Loan Amount |
|---|---|---|---|
| Open | Olson Sharon L | $105,750 | |
| Previous Owner | Johnson Natalie S | $86,400 | |
| Previous Owner | Thornton James | $74,160 |
Source: Public Records
Tax History
| Year | Tax Paid | Tax Assessment Tax Assessment Total Assessment is a certain percentage of the fair market value that is determined by local assessors to be the total taxable value of land and additions on the property. | Land | Improvement |
|---|---|---|---|---|
| 2025 | $900 | $10,837 | -- | -- |
| 2024 | $910 | $10,321 | -- | -- |
| 2023 | $910 | $27,970 | $5,590 | $22,380 |
| 2022 | $890 | $21,430 | $4,280 | $17,150 |
| 2021 | $914 | $20,210 | $4,040 | $16,170 |
| 2020 | $902 | $18,080 | $3,610 | $14,470 |
| 2019 | $836 | $15,680 | $3,130 | $12,550 |
| 2018 | $798 | $14,360 | $2,870 | $11,490 |
| 2017 | $773 | $12,530 | $2,500 | $10,030 |
| 2016 | $759 | $11,450 | $2,290 | $9,160 |
| 2015 | $716 | $10,260 | $2,050 | $8,210 |
Source: Public Records
Map
Nearby Homes
- 1030 South Spur
- 943 S Lazona Dr
- 1551 E Florian Cir
- 1022 S Allen
- 1246 E Millett Ave
- 749 S Lazona Dr
- 1626 E Garnet Ave
- 1431 E Garnet Ave
- 1341 E Garnet Cir
- 1308 South Spur
- 1030 S Stapley Dr Unit TR-B
- 1602 E Grove Ave
- 1123 E 9th Dr
- 1050 S Stapley Dr Unit 30
- 760 S Stapley Dr
- 1248 E Grove Cir
- 1448 S Doran
- 610 S Stapley Dr
- 1041 E Garnet Ave
- 1051 E Glade Ave
- 1457 E Emerald Ave
- 1445 E Emerald Ave
- 1458 E Forge Ave
- 1452 E Forge Ave
- 1466 E Forge Ave
- 1439 E Emerald Ave
- 1432 E Emerald Ave
- 1432 E Emerald Ave Unit 747
- 1432 E Emerald Ave Unit 46
- 1446 E Forge Ave
- 1446 E Emerald Ave
- 1506 E Forge Ave Unit 1
- 1452 E Emerald Ave
- 1438 E Emerald Ave
- 1460 E Emerald Ave
- 1505 E Emerald Ave Unit 1
- 1440 E Forge Ave
- 1431 E Emerald Ave
- 1512 E Forge Ave
- 1430 E Emerald Ave
Your Personal Tour Guide
Ask me questions while you tour the home.