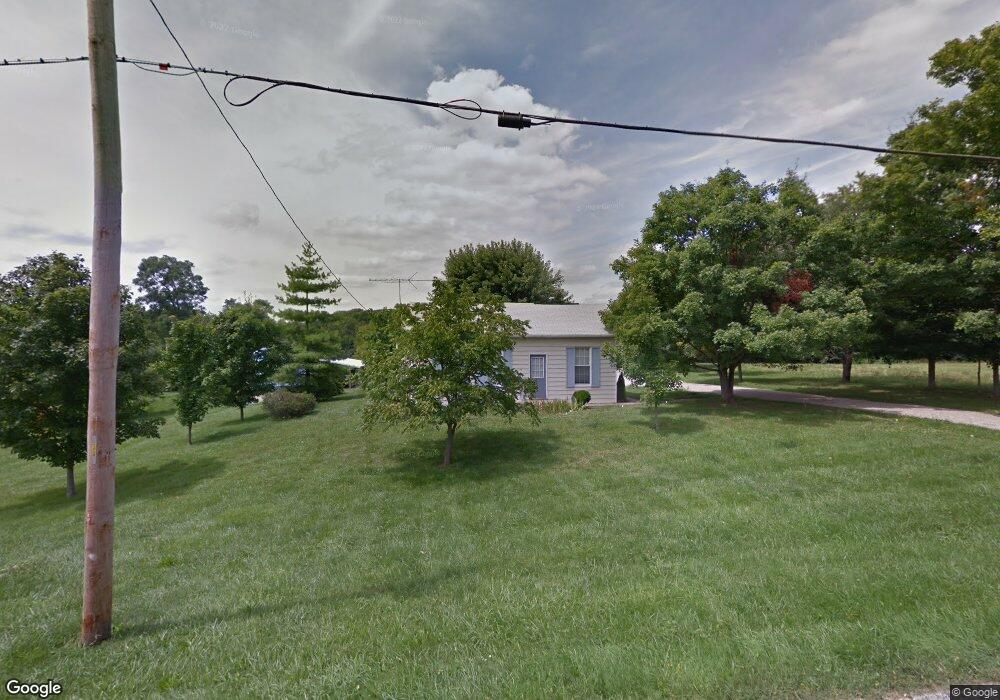
1451 Weaver Rd Okeana, OH 45053
Estimated Value: $316,000 - $365,000
2
Beds
1
Bath
1,236
Sq Ft
$278/Sq Ft
Est. Value
About This Home
This home is located at 1451 Weaver Rd, Okeana, OH 45053 and is currently estimated at $344,151, approximately $278 per square foot. 1451 Weaver Rd is a home located in Butler County with nearby schools including Morgan Elementary School, Ross Middle School, and Ross Intermediate School.
Ownership History
Date
Name
Owned For
Owner Type
Purchase Details
Closed on
Nov 12, 2021
Sold by
Faulconer Kayla R and Geyman Michelel L
Bought by
Wright Kimberly Ann
Current Estimated Value
Home Financials for this Owner
Home Financials are based on the most recent Mortgage that was taken out on this home.
Original Mortgage
$297,979
Outstanding Balance
$273,046
Interest Rate
2.99%
Mortgage Type
USDA
Estimated Equity
$71,105
Purchase Details
Closed on
May 15, 2019
Sold by
Lees Timothy P and Lees Jan
Bought by
Geyman Michelle L and Faulconer Kayla R
Home Financials for this Owner
Home Financials are based on the most recent Mortgage that was taken out on this home.
Original Mortgage
$220,924
Interest Rate
5.75%
Mortgage Type
FHA
Purchase Details
Closed on
Jun 8, 2015
Sold by
Lees Timothy P and Lees Jan
Bought by
Lees Timothy P and Lees Jan
Purchase Details
Closed on
May 17, 2012
Sold by
Schwab Daniel E
Bought by
Lees Timothy B and Lees Janet M
Create a Home Valuation Report for This Property
The Home Valuation Report is an in-depth analysis detailing your home's value as well as a comparison with similar homes in the area
Home Values in the Area
Average Home Value in this Area
Purchase History
| Date | Buyer | Sale Price | Title Company |
|---|---|---|---|
| Wright Kimberly Ann | $295,000 | Mattingly Ford Ttl Svcs Llc | |
| Geyman Michelle L | $225,000 | Lawyers Title Of Cincinnati | |
| Lees Timothy P | -- | Attorney | |
| Lees Timothy B | $89,900 | None Available |
Source: Public Records
Mortgage History
| Date | Status | Borrower | Loan Amount |
|---|---|---|---|
| Open | Wright Kimberly Ann | $297,979 | |
| Previous Owner | Geyman Michelle L | $220,924 |
Source: Public Records
Tax History Compared to Growth
Tax History
| Year | Tax Paid | Tax Assessment Tax Assessment Total Assessment is a certain percentage of the fair market value that is determined by local assessors to be the total taxable value of land and additions on the property. | Land | Improvement |
|---|---|---|---|---|
| 2024 | $3,143 | $88,050 | $32,340 | $55,710 |
| 2023 | $3,126 | $88,050 | $32,340 | $55,710 |
| 2022 | $2,479 | $62,100 | $32,340 | $29,760 |
| 2021 | $2,362 | $62,100 | $32,340 | $29,760 |
| 2020 | $2,468 | $62,100 | $32,340 | $29,760 |
| 2019 | $3,295 | $46,210 | $32,340 | $13,870 |
| 2018 | $1,856 | $46,210 | $32,340 | $13,870 |
| 2017 | $1,833 | $46,210 | $32,340 | $13,870 |
| 2016 | $1,796 | $43,760 | $32,340 | $11,420 |
| 2015 | $1,798 | $43,760 | $32,340 | $11,420 |
| 2014 | $1,849 | $43,760 | $32,340 | $11,420 |
| 2013 | $1,849 | $44,470 | $27,720 | $16,750 |
Source: Public Records
Map
Nearby Homes
- 7943 Hamilton Scipio Rd
- 0 Hamilton Scipio Rd Unit 1855354
- 1194 State Rd 252 Rd E
- 0 Sample Rd
- 2521 Bell Rd
- 4790 Hamilton Scipio Rd
- 1922 Rebecca Ridge
- 7768 Lorraine Dr
- 4499 Layhigh Rd
- 1032 Oak Haven Ln
- 1068 Oak Haven Ln
- 2326 Morgan Ross Rd
- 3998 Buck Ridge Dr
- 4105 Schoenling Rd
- 0 Howards Creek Rd Unit 1851057
- 2188 Carolina Trace Rd
- 1895 Reily Woods Ln
- 4324 Howards Creek Rd
- 2031 Millville Shandon Rd
- 4380 Howards Creek Rd
- 1451 Weaver Rd
- 1463 S Weaver Rd
- 1463 Weaver Rd
- 1475 S Weaver Rd
- 1475 Weaver Rd
- 1450 Weaver Rd
- 1450 Weaver Rd
- 1401 Weaver Rd
- 1467 Weaver Rd
- 1467 S Weaver Rd
- 1515 Weaver Rd
- 1515 Weaver Rd
- 1448 Weaver Rd
- 1448 Weaver Rd
- 1564 Weaver Rd
- 1283 Weaver Rd
- 1615 Weaver Rd
- 1627 Weaver Rd
- 1253 Weaver Rd
- 1624 Weaver Rd