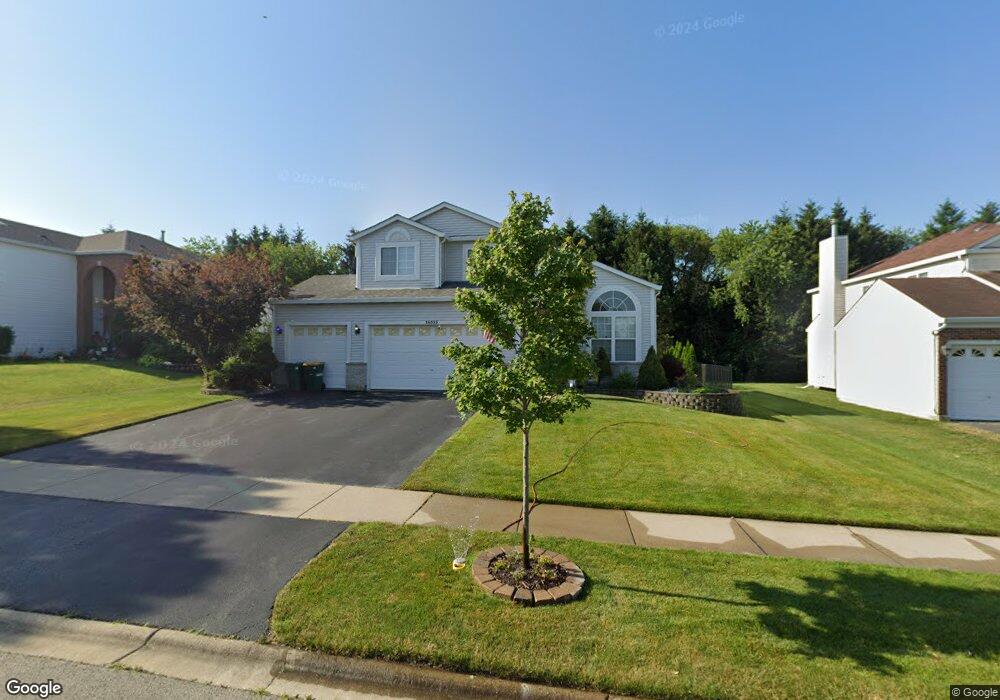
14513 Etchingham Dr Lockport, IL 60441
South Homer Glen NeighborhoodEstimated Value: $376,327 - $506,000
Studio
--
Bath
1,928
Sq Ft
$239/Sq Ft
Est. Value
About This Home
This home is located at 14513 Etchingham Dr, Lockport, IL 60441 and is currently estimated at $460,832, approximately $239 per square foot. 14513 Etchingham Dr is a home located in Will County with nearby schools including William E Young School, Hadley Middle School, and Homer Jr High School.
Ownership History
Date
Name
Owned For
Owner Type
Purchase Details
Closed on
Nov 5, 2020
Sold by
Vander Velde Karen L and Vander Velde Paul
Bought by
Vander Velde Paul J and Vander Velde Karen
Current Estimated Value
Home Financials for this Owner
Home Financials are based on the most recent Mortgage that was taken out on this home.
Original Mortgage
$186,000
Outstanding Balance
$96,395
Interest Rate
2.8%
Mortgage Type
New Conventional
Estimated Equity
$364,437
Purchase Details
Closed on
Sep 26, 2002
Sold by
Montalbano Builders Inc
Bought by
Zoppa Karen L
Home Financials for this Owner
Home Financials are based on the most recent Mortgage that was taken out on this home.
Original Mortgage
$188,000
Interest Rate
6.32%
Create a Home Valuation Report for This Property
The Home Valuation Report is an in-depth analysis detailing your home's value as well as a comparison with similar homes in the area
Home Values in the Area
Average Home Value in this Area
Purchase History
| Date | Buyer | Sale Price | Title Company |
|---|---|---|---|
| Vander Velde Paul J | -- | Attorney | |
| Zoppa Karen L | $225,500 | First American Title |
Source: Public Records
Mortgage History
| Date | Status | Borrower | Loan Amount |
|---|---|---|---|
| Open | Vander Velde Paul J | $186,000 | |
| Closed | Zoppa Karen L | $188,000 |
Source: Public Records
Tax History
| Year | Tax Paid | Tax Assessment Tax Assessment Total Assessment is a certain percentage of the fair market value that is determined by local assessors to be the total taxable value of land and additions on the property. | Land | Improvement |
|---|---|---|---|---|
| 2024 | $9,417 | $116,132 | $21,398 | $94,734 |
| 2023 | $9,417 | $105,268 | $19,396 | $85,872 |
| 2022 | $7,805 | $89,368 | $18,110 | $71,258 |
| 2021 | $7,442 | $84,669 | $17,158 | $67,511 |
| 2020 | $7,406 | $81,554 | $16,527 | $65,027 |
| 2019 | $7,182 | $78,455 | $15,899 | $62,556 |
| 2018 | $6,914 | $75,023 | $15,717 | $59,306 |
| 2017 | $6,789 | $72,923 | $15,277 | $57,646 |
| 2016 | $6,633 | $70,492 | $14,768 | $55,724 |
| 2015 | $6,441 | $67,846 | $14,214 | $53,632 |
| 2014 | $6,441 | $66,444 | $13,920 | $52,524 |
| 2013 | $6,441 | $66,444 | $13,920 | $52,524 |
Source: Public Records
Map
Nearby Homes
- 16450 S Cedar Rd
- 14902 W Victoria Crossing Unit T1685
- 16340 S Alberta Ct
- 16514 Pine Hill Dr
- 14549 W 159th St
- 17356 S Sprucewood Dr
- 16604 Pine Hill Dr
- 0B W 159th St
- 0 NW 159th Parker St Unit MRD12445910
- 1,2 W Rambling Rd
- 16509 S Sun Meadow Dr
- 12362 W 159th St
- 0 W 159th St
- 15326 W Harvest Ln
- 16614 S Silo Bend Dr
- 13874 S Penny Ln
- 15455 W Amelia Cir
- 13721 W 167th St
- 16517 S Brook Ln
- 16646 S Sun Meadow Dr
- 14505 Etchingham Dr
- 14521 Etchingham Dr
- 14467 Etchingham Dr
- 14512 Etchingham Dr
- 14504 Etchingham Dr
- 14520 Etchingham Dr
- 14459 Etchingham Dr
- 14468 Etchingham Dr
- 14528 Etchingham Dr
- 14537 Etchingham Dr
- 14560 W 167th St
- 14536 Etchingham Dr
- 14460 Etchingham Dr
- 14451 Etchingham Dr
- 14517 W Melbourne Place
- 14509 W Melbourne Place
- 14525 W Melbourne Place Unit 6
- 14545 Etchingham Dr
- 14501 W Melbourne Place
- 14544 Etchingham Dr
Your Personal Tour Guide
Ask me questions while you tour the home.