Estimated Value: $197,000 - $273,000
3
Beds
2
Baths
1,126
Sq Ft
$207/Sq Ft
Est. Value
About This Home
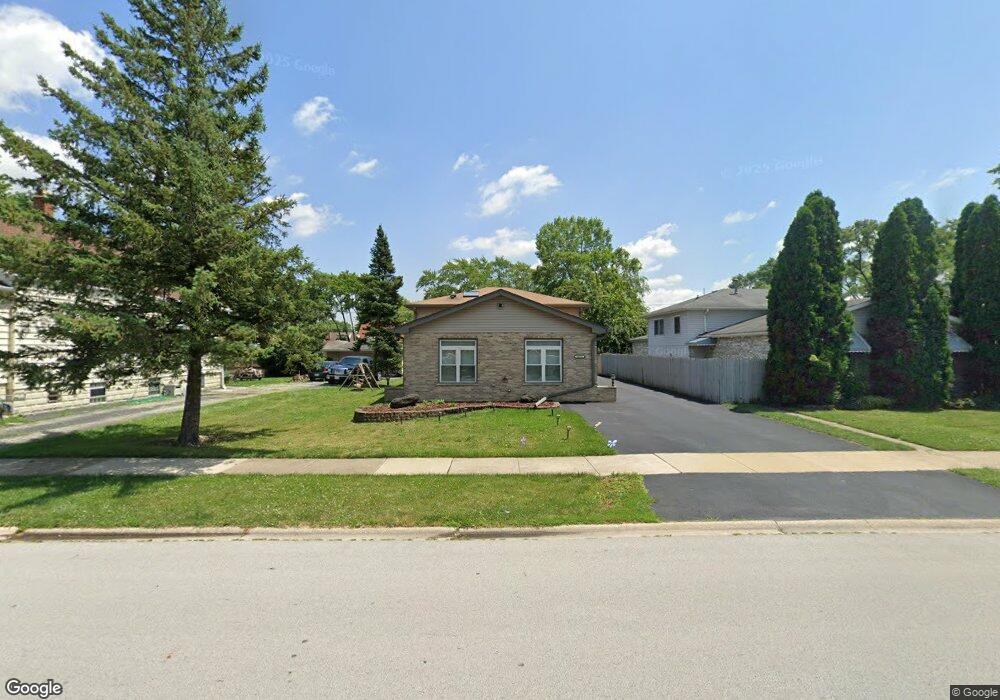
This home is located at 14513 S Harrison Ave, Posen, IL 60469 and is currently estimated at $232,579, approximately $206 per square foot. 14513 S Harrison Ave is a home located in Cook County with nearby schools including Delia M. Turner Elementary School, Posen Intermediate School, and Thomas J. Kellar Middle School.
Ownership History
Date
Name
Owned For
Owner Type
Purchase Details
Closed on
Mar 18, 2011
Sold by
Bourne Timothy F and Bourne Paula J
Bought by
Skalnik Nicholas R
Current Estimated Value
Home Financials for this Owner
Home Financials are based on the most recent Mortgage that was taken out on this home.
Original Mortgage
$130,603
Outstanding Balance
$90,075
Interest Rate
4.87%
Mortgage Type
FHA
Estimated Equity
$142,504
Purchase Details
Closed on
Apr 3, 1995
Sold by
Eck Custom Mason Work Company
Bought by
Bourne Timothy F and Bourne Paula J
Home Financials for this Owner
Home Financials are based on the most recent Mortgage that was taken out on this home.
Original Mortgage
$96,900
Interest Rate
8.55%
Purchase Details
Closed on
Jul 21, 1994
Sold by
Pdw Corp
Bought by
Eck Thomas and Eck Custom Mason
Create a Home Valuation Report for This Property
The Home Valuation Report is an in-depth analysis detailing your home's value as well as a comparison with similar homes in the area
Home Values in the Area
Average Home Value in this Area
Purchase History
| Date | Buyer | Sale Price | Title Company |
|---|---|---|---|
| Skalnik Nicholas R | -- | Stewart Title Company | |
| Bourne Timothy F | $102,000 | -- | |
| Eck Thomas | $15,000 | -- |
Source: Public Records
Mortgage History
| Date | Status | Borrower | Loan Amount |
|---|---|---|---|
| Open | Skalnik Nicholas R | $130,603 | |
| Previous Owner | Bourne Timothy F | $96,900 |
Source: Public Records
Tax History Compared to Growth
Tax History
| Year | Tax Paid | Tax Assessment Tax Assessment Total Assessment is a certain percentage of the fair market value that is determined by local assessors to be the total taxable value of land and additions on the property. | Land | Improvement |
|---|---|---|---|---|
| 2024 | $4,010 | $12,199 | $1,103 | $11,096 |
| 2023 | $3,602 | $12,199 | $1,103 | $11,096 |
| 2022 | $3,602 | $8,657 | $945 | $7,712 |
| 2021 | $3,521 | $8,656 | $945 | $7,711 |
| 2020 | $2,476 | $8,656 | $945 | $7,711 |
| 2019 | $2,899 | $10,091 | $866 | $9,225 |
| 2018 | $2,851 | $10,091 | $866 | $9,225 |
| 2017 | $2,926 | $10,091 | $866 | $9,225 |
| 2016 | $3,049 | $9,721 | $787 | $8,934 |
| 2015 | $2,948 | $9,721 | $787 | $8,934 |
| 2014 | $2,930 | $9,721 | $787 | $8,934 |
| 2013 | $2,717 | $10,052 | $787 | $9,265 |
Source: Public Records
Map
Nearby Homes
- 14600 S Cleveland Ave
- 14601 S Palmer Ave
- 14544 S San Francisco Ave
- 2606 W Walter Zimny Dr
- 14720 S Harrison Ave
- 14730 S California Ave
- 14337 S Mckinley Ave
- 14619 S Albany Ave
- 14727 S Whipple St
- 14901 S Richmond Ave
- 14929 Cleveland Ave
- 2900 141st Place
- 14715 Maplewood Ave
- 14719 Maplewood Ave
- 14610 Sawyer Ave
- 3127 141st Place
- 3131 141st Place
- 2904 140th St
- 14825 Maplewood Ave
- 14525 Oakley St
- 14513 S Harrison Ave
- 14517 S Harrison Ave
- 14509 S Harrison Ave
- 14519 S Harrison Ave
- 14505 S Harrison Ave
- 14512 S Cleveland Ave
- 14512 S Cleveland Ave
- 14508 S Cleveland Ave
- 14508 S Cleveland Ave
- 14501 S Harrison Ave
- 14439 S Sherman Ave
- 14447 S Sherman Ave
- 14504 S Cleveland Ave
- 14523 S Harrison Ave
- 9999 Confidential
- 99999 Confidential Ave
- 14500 S Cleveland Ave
- 14533 S Harrison Ave
- 14445 S Harrison Ave
- 14445 S Harrison Ave