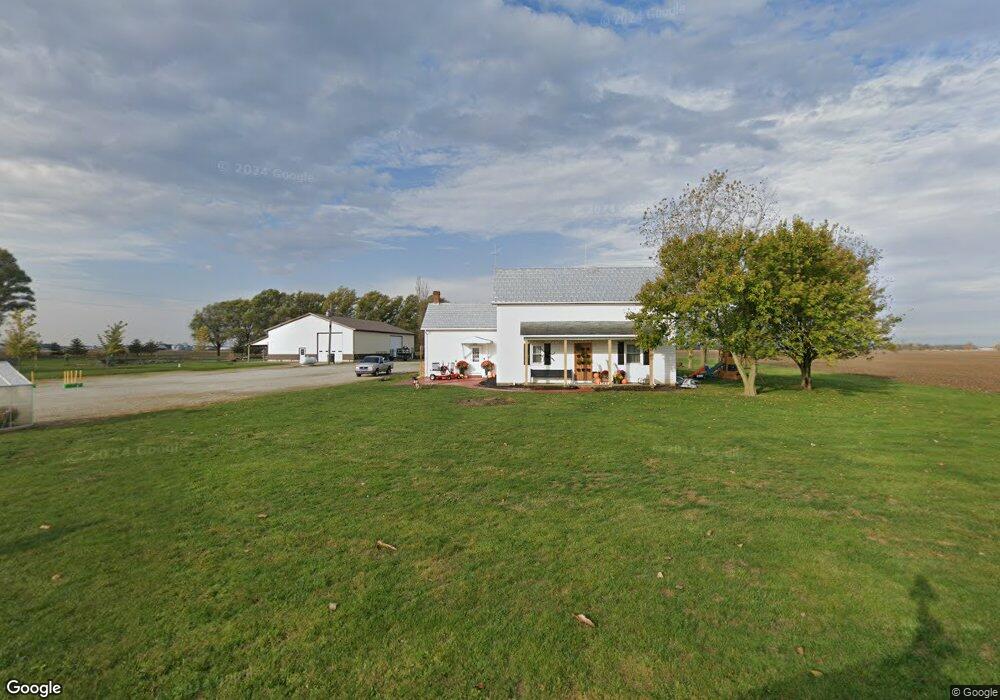
14516 Coble Rd Yorkshire, OH 45388
Estimated Value: $269,000 - $366,000
4
Beds
3
Baths
2,410
Sq Ft
$133/Sq Ft
Est. Value
About This Home
This home is located at 14516 Coble Rd, Yorkshire, OH 45388 and is currently estimated at $321,237, approximately $133 per square foot. 14516 Coble Rd is a home with nearby schools including Marion Local Elementary School and Marion Local High School.
Ownership History
Date
Name
Owned For
Owner Type
Purchase Details
Closed on
Jun 28, 2019
Sold by
Mueller Elmer A and Mueller Jean A
Bought by
Hoelscher Austin M
Current Estimated Value
Home Financials for this Owner
Home Financials are based on the most recent Mortgage that was taken out on this home.
Original Mortgage
$161,500
Outstanding Balance
$140,207
Interest Rate
4%
Mortgage Type
Future Advance Clause Open End Mortgage
Estimated Equity
$181,030
Purchase Details
Closed on
Dec 20, 2005
Sold by
Mueller Anthony P and Mueller Tracey J
Bought by
Mueller Elmer A and Mueller Jean A
Create a Home Valuation Report for This Property
The Home Valuation Report is an in-depth analysis detailing your home's value as well as a comparison with similar homes in the area
Purchase History
| Date | Buyer | Sale Price | Title Company |
|---|---|---|---|
| Hoelscher Austin M | $170,000 | Republic Title Agency Inc | |
| Mueller Elmer A | $123,000 | None Available |
Source: Public Records
Mortgage History
| Date | Status | Borrower | Loan Amount |
|---|---|---|---|
| Open | Hoelscher Austin M | $161,500 |
Source: Public Records
Tax History
| Year | Tax Paid | Tax Assessment Tax Assessment Total Assessment is a certain percentage of the fair market value that is determined by local assessors to be the total taxable value of land and additions on the property. | Land | Improvement |
|---|---|---|---|---|
| 2025 | $2,610 | $72,050 | $8,530 | $63,520 |
| 2024 | $2,610 | $72,050 | $8,530 | $63,520 |
| 2023 | $2,612 | $72,050 | $8,530 | $63,520 |
| 2022 | $2,045 | $55,040 | $7,230 | $47,810 |
| 2021 | $2,084 | $55,040 | $7,230 | $47,810 |
| 2020 | $2,090 | $55,040 | $7,230 | $47,810 |
| 2019 | $982 | $34,170 | $7,130 | $27,040 |
| 2018 | $1,024 | $34,170 | $7,130 | $27,040 |
| 2017 | $708 | $34,170 | $7,130 | $27,040 |
| 2016 | $698 | $26,420 | $6,920 | $19,500 |
| 2015 | $698 | $26,420 | $6,920 | $19,500 |
| 2014 | $699 | $26,420 | $6,920 | $19,500 |
| 2013 | $774 | $26,140 | $6,640 | $19,500 |
Source: Public Records
Map
Nearby Homes
Your Personal Tour Guide
Ask me questions while you tour the home.