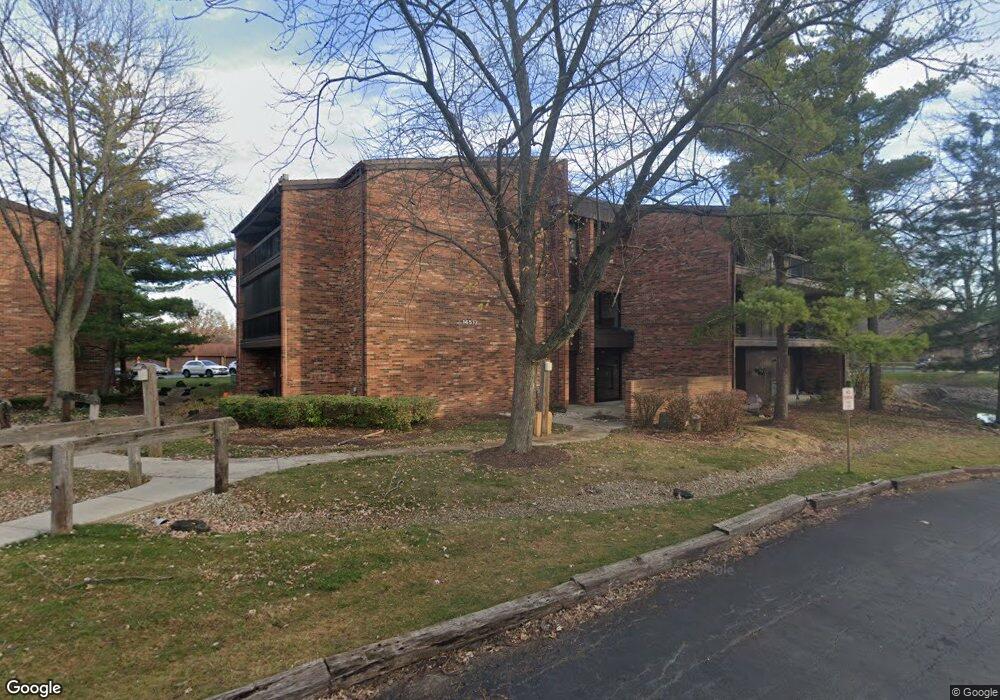
14517 Sussex Ct Unit 14517G Oak Forest, IL 60452
Estimated Value: $146,000 - $152,000
1
Bed
1
Bath
800
Sq Ft
$186/Sq Ft
Est. Value
About This Home
This home is located at 14517 Sussex Ct Unit 14517G, Oak Forest, IL 60452 and is currently estimated at $148,409, approximately $185 per square foot. 14517 Sussex Ct Unit 14517G is a home located in Cook County with nearby schools including Kerkstra Elementary School, Jack Hille Middle School, and Oak Forest High School.
Ownership History
Date
Name
Owned For
Owner Type
Purchase Details
Closed on
Mar 25, 2025
Sold by
Revocable Living Trust Of Diane L Solger and Solger Diane L
Bought by
Habrelewicz Matthew
Current Estimated Value
Home Financials for this Owner
Home Financials are based on the most recent Mortgage that was taken out on this home.
Original Mortgage
$128,205
Outstanding Balance
$127,466
Interest Rate
6.25%
Mortgage Type
FHA
Estimated Equity
$20,943
Purchase Details
Closed on
Aug 18, 2010
Sold by
Solger Diane
Bought by
Solger Diane L and Revocable Living Trust Of Diane L Solger
Purchase Details
Closed on
Aug 31, 2005
Sold by
Hillberry Susan J
Bought by
Solger Diane L
Home Financials for this Owner
Home Financials are based on the most recent Mortgage that was taken out on this home.
Original Mortgage
$60,000
Interest Rate
6.01%
Mortgage Type
Fannie Mae Freddie Mac
Create a Home Valuation Report for This Property
The Home Valuation Report is an in-depth analysis detailing your home's value as well as a comparison with similar homes in the area
Home Values in the Area
Average Home Value in this Area
Purchase History
| Date | Buyer | Sale Price | Title Company |
|---|---|---|---|
| Habrelewicz Matthew | $146,000 | None Listed On Document | |
| Solger Diane L | -- | None Available | |
| Solger Diane L | $130,000 | -- |
Source: Public Records
Mortgage History
| Date | Status | Borrower | Loan Amount |
|---|---|---|---|
| Open | Habrelewicz Matthew | $128,205 | |
| Previous Owner | Solger Diane L | $60,000 |
Source: Public Records
Tax History Compared to Growth
Tax History
| Year | Tax Paid | Tax Assessment Tax Assessment Total Assessment is a certain percentage of the fair market value that is determined by local assessors to be the total taxable value of land and additions on the property. | Land | Improvement |
|---|---|---|---|---|
| 2024 | $2,507 | $11,330 | $782 | $10,548 |
| 2023 | $1,797 | $11,330 | $782 | $10,548 |
| 2022 | $1,797 | $7,702 | $782 | $6,920 |
| 2021 | $1,790 | $7,701 | $781 | $6,920 |
| 2020 | $1,810 | $7,701 | $781 | $6,920 |
| 2019 | $1,337 | $6,748 | $732 | $6,016 |
| 2018 | $1,312 | $6,748 | $732 | $6,016 |
| 2017 | $1,340 | $6,748 | $732 | $6,016 |
| 2016 | $2,098 | $7,602 | $635 | $6,967 |
| 2015 | $1,997 | $7,602 | $635 | $6,967 |
| 2014 | $1,960 | $7,602 | $635 | $6,967 |
| 2013 | $1,755 | $7,658 | $635 | $7,023 |
Source: Public Records
Map
Nearby Homes
- 14515 Central Ct Unit G3
- 14511 Central Ct Unit M2
- 14533 Walden Ct Unit G2
- 14825 Parkside Ave
- 14778 Massasoit Ave
- 5700 La Palm Dr
- 14913 Sheila Ct
- 13933 James Dr Unit 816
- 14457 Lamon Ave Unit 3N
- 13913 James Dr Unit 1017
- 13919 W Leamington Dr Unit 806
- 16207 Long Ave
- 5018 Midlothian Turnpike Unit 1009
- 5041 139th Place Unit 406
- 15251 Colina Ave
- 15119 Laporte Ave
- 5208 Woodland Dr Unit A
- 14840 Kilpatrick Ave Unit 604
- 4653 146th St
- 14947 Landings Ln
- 14517 Sussex Ct Unit M2
- 14517 Sussex Ct Unit GF7
- 14517 Sussex Ct Unit GE11
- 14517 Sussex Ct Unit 14517M
- 14517 Sussex Ct Unit GF6
- 14517 Sussex Ct Unit GF8
- 14517 Sussex Ct Unit GF1
- 14517 Sussex Ct Unit 14517G
- 14517 Sussex Ct Unit 14517G
- 14517 Sussex Ct Unit 14517PH
- 14517 Sussex Ct Unit 14517M
- 14517 Sussex Ct Unit GF10
- 14517 Sussex Ct Unit 14517PH
- 14517 Sussex Ct Unit 14517M
- 14517 Sussex Ct Unit 14517PH
- 14517 Sussex Ct Unit GC9
- 14517 Sussex Ct Unit 14517M
- 14517 Sussex Ct Unit GI5
- 14517 Sussex Ct Unit 14517G
- 14517 Sussex Ct Unit 14517PH