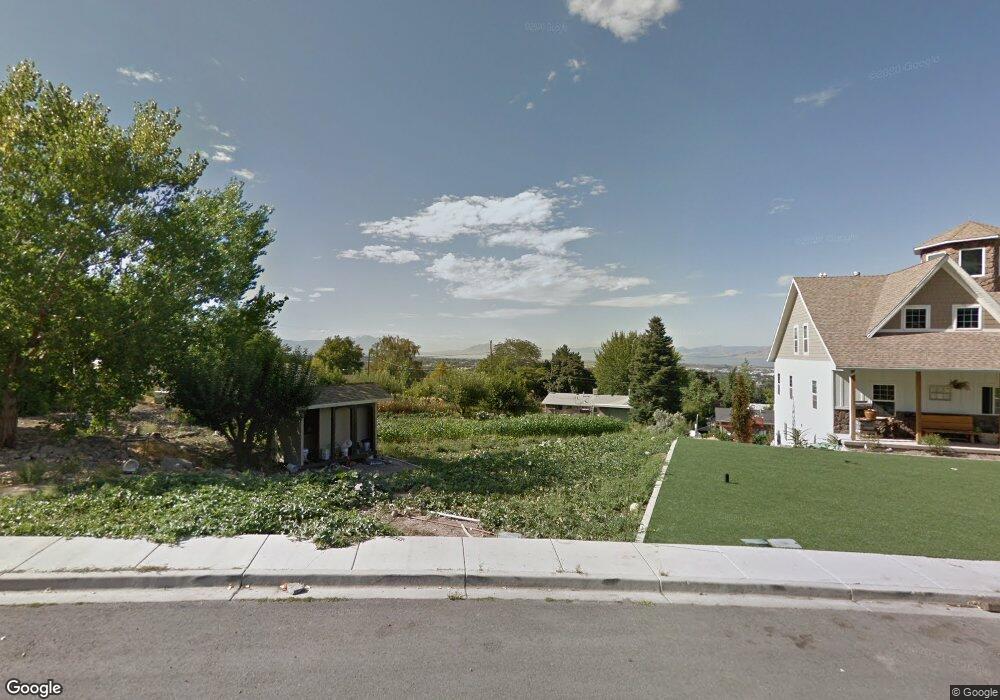
1452 E 430 S Pleasant Grove, UT 84062
Estimated Value: $1,021,000 - $1,923,950
5
Beds
4
Baths
5,377
Sq Ft
$284/Sq Ft
Est. Value
About This Home
This home is located at 1452 E 430 S, Pleasant Grove, UT 84062 and is currently estimated at $1,525,317, approximately $283 per square foot. 1452 E 430 S is a home with nearby schools including Valley View Elementary, Central Elementary School, and Oak Canyon Junior High School.
Ownership History
Date
Name
Owned For
Owner Type
Purchase Details
Closed on
Feb 2, 2022
Sold by
Carver Cim Winsor
Bought by
Ck Family Trust and Carver
Current Estimated Value
Purchase Details
Closed on
Feb 16, 2021
Sold by
Carver Cim and Carver Kathryn
Bought by
Carver Cim Winsor
Home Financials for this Owner
Home Financials are based on the most recent Mortgage that was taken out on this home.
Original Mortgage
$548,250
Interest Rate
2.6%
Mortgage Type
Construction
Purchase Details
Closed on
Feb 12, 2021
Sold by
Carver Cim and Carver Kathryn
Bought by
Carver Cim Winsor
Home Financials for this Owner
Home Financials are based on the most recent Mortgage that was taken out on this home.
Original Mortgage
$548,250
Interest Rate
2.6%
Mortgage Type
Construction
Purchase Details
Closed on
Jun 19, 2020
Sold by
Johnson Sandra Stone and Stone Shirl Ammon
Bought by
Carver Cim and Carver Kathryn
Purchase Details
Closed on
Nov 6, 2015
Sold by
Stone Shirley
Bought by
Stone Shirley Rust and Chester Ammon Stone Family Protection Tr
Create a Home Valuation Report for This Property
The Home Valuation Report is an in-depth analysis detailing your home's value as well as a comparison with similar homes in the area
Home Values in the Area
Average Home Value in this Area
Purchase History
| Date | Buyer | Sale Price | Title Company |
|---|---|---|---|
| Ck Family Trust | -- | Crossland Title | |
| Carver Cim Winsor | -- | Crossland Title | |
| Carver Cim Winsor | -- | Crossland Title | |
| Carver Cim | -- | Real Advantage Ttl Ins Agcy | |
| Stone Shirley Rust | -- | None Available |
Source: Public Records
Mortgage History
| Date | Status | Borrower | Loan Amount |
|---|---|---|---|
| Previous Owner | Carver Cim Winsor | $548,250 | |
| Previous Owner | Carver Cim Winsor | $548,250 |
Source: Public Records
Tax History Compared to Growth
Tax History
| Year | Tax Paid | Tax Assessment Tax Assessment Total Assessment is a certain percentage of the fair market value that is determined by local assessors to be the total taxable value of land and additions on the property. | Land | Improvement |
|---|---|---|---|---|
| 2025 | $7,758 | $988,020 | $422,300 | $1,374,100 |
| 2024 | $7,758 | $926,860 | $0 | $0 |
| 2023 | $7,928 | $968,605 | $0 | $0 |
| 2022 | $5,757 | $699,875 | $0 | $0 |
| 2021 | $2,436 | $248,000 | $248,000 | $0 |
| 2020 | $2,301 | $229,600 | $229,600 | $0 |
| 2019 | $1,308 | $135,000 | $135,000 | $0 |
| 2018 | $1,291 | $126,000 | $126,000 | $0 |
| 2017 | $1,191 | $112,500 | $0 | $0 |
| 2016 | $987 | $90,000 | $0 | $0 |
| 2015 | $938 | $81,000 | $0 | $0 |
| 2014 | $905 | $77,400 | $0 | $0 |
Source: Public Records
Map
Nearby Homes
- 521 S 1660 E
- 650 S 1600 E
- 1515 E 720 S
- 745 S 1500 St E
- 1172 E Murdock Dr
- 10 S 1400 E
- 935 S 1500 E
- 177 S 1150 E
- 286 S 1150 E
- Prelude Plan at Blossom Hill
- Treble Plan at Blossom Hill
- Browning Plan at Blossom Hill
- Cantata Plan at Blossom Hill
- 176 S 1150 E
- Accord Plan at Blossom Hill
- Canon Plan at Blossom Hill
- Trio Plan at Blossom Hill
- Harrison Plan at Blossom Hill
- Adagio Plan at Blossom Hill
- Tempo Plan at Blossom Hill